
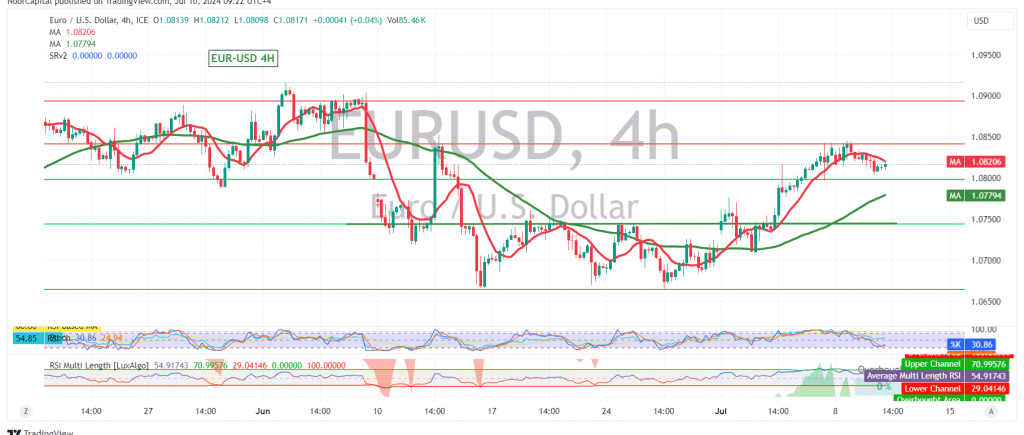
The EUR/USD pair has been trading within a narrow range, confined between the support level of 1.0800 and the pivotal resistance at 1.0840. Technical analysis indicates a potential for a bullish breakout, but caution is warranted.
Key Technical Signals:
- Support Level: The pair has found solid support near the psychological barrier of 1.0800.
- Moving Averages: Simple moving averages (SMAs) continue to provide positive support, reinforcing the bullish bias.
- Stochastic Oscillator: The stochastic oscillator shows signs of shaking off recent negativity, suggesting a potential for renewed upward momentum.
- Fibonacci Retracement: The successful break and subsequent retest of the 50.0% Fibonacci retracement level (1.0760) as support further solidifies the bullish outlook.
Upward Potential:
A break above the 1.0840 resistance level could trigger a significant upward move, initially targeting 1.0880 and potentially extending towards 1.0915.
Downside Risks:
A failure to break above 1.0840 and a subsequent decline below the 1.0760 support level could lead to sideways trading or a potential bearish reversal. A break below 1.0720 (61.80% Fibonacci retracement) would significantly increase downside pressure, potentially targeting 1.0660.
Caution:
- High-Impact Economic Data: Today’s testimony by Fed Chairman Jerome Powell could introduce significant volatility into the market. Traders should exercise caution during this event.
Overall Assessment:
The EUR/USD pair shows bullish potential, with key technical indicators supporting the possibility of an upward breakout. However, the narrow trading range and potential for volatility due to upcoming economic data necessitate a cautious approach.
Disclaimer: Trading in CFDs carries inherent risks. The analysis provided herein is not a recommendation to buy or sell, but rather an interpretation of the current price movement on the chart.
| S1: |