
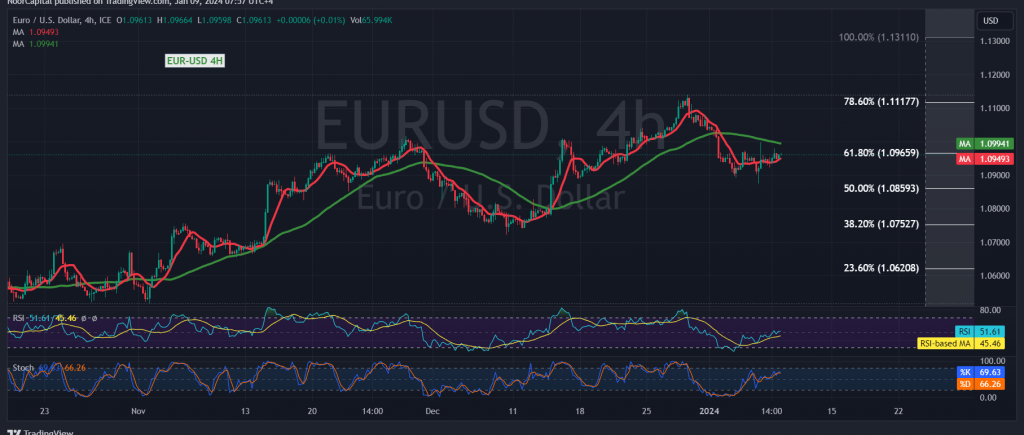
During the initial trading sessions of the week, the EUR/USD pair exhibited subdued movements, testing the 1.0960 resistance level without successfully breaching it.
On the technical front, a closer look at the 240-minute time frame chart reveals the pair’s consolidation below the 50-day simple moving average, exerting downward pressure. Furthermore, the Stochastic indicator displays clear negative signals, gradually losing its upward momentum.
With the price remaining below 1.0960, a robust resistance positioned at the 61.80% Fibonacci retracement, the prevailing bearish bias is favored. Breaking below 1.0930 would facilitate a move towards 1.0900, followed by 1.0860, representing the 50.0% retracement level as the next significant support.
For a potential shift in momentum, the EUR/USD pair would need to close at least above 1.0960, and more crucially, surpass 1.0985. Such a move could pave the way for an upward wave, targeting levels starting at 1.1050 and extending towards 1.1080.
Note: Trading on CFDs involves risks. Therefore, all scenarios may be possible. This article is not a recommendation to buy or sell but rather an explanatory reading of the price movement on the chart.
| S1: |