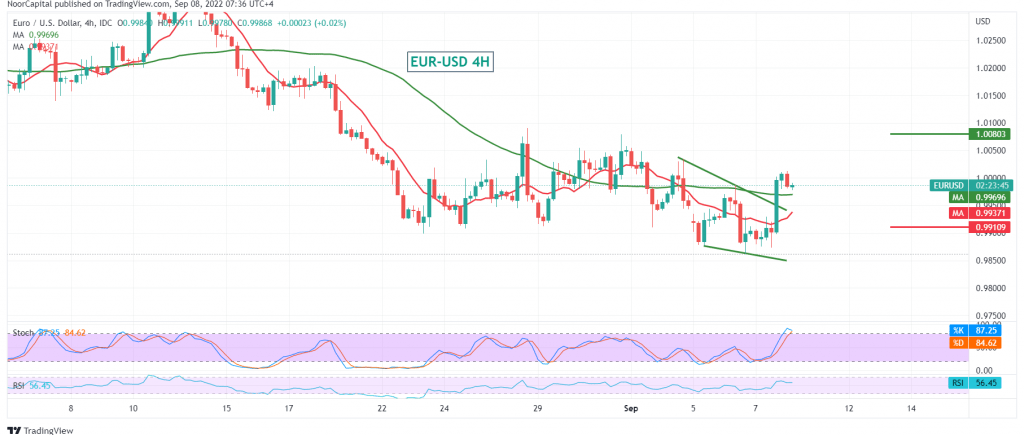
Mixed trading dominated the movements of the euro against the US dollar, to witness a bearish tendency during the middle of the European session, after it succeeded in pressing the support level of 0.9900 to see a decline near 0.9875, taking advantage of the mentioned level that forced it to form an ascending attack to retest the pivotal resistance level represented at the parity point 1.0000, with a high of 1.013.
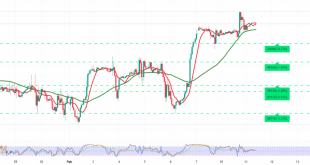
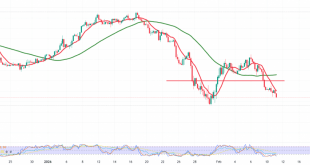
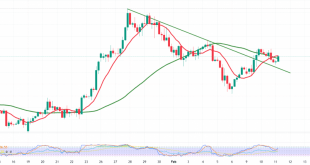
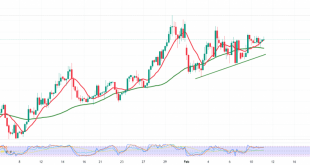
On the technical side today, we find the 50-day simple moving average that returned to carry the price from below, in support of a bullish bias during the coming hours, accompanied by intraday stability above 0.9960; on the other hand, we find stochastic around the overbought areas, in addition to the stability of trading below the pivotal resistance 1.0000, which supports the return of the trend descending again.
With the conflict of the leading technical signals, we prefer to monitor the price behaviour until the next price movement becomes clear so that we are facing one of the following scenarios:
To get a bullish bias, we need to witness the price breaching the resistance mentioned above of 1.0000, and that is a catalyst to start a recovery wave whose initial target is 1.0040, and then 1.0080, taking into consideration that the break above and above 1.0080 forces the euro to enter an upward correction whose targets are at 1.0180.
To resume the official bearish trend, we need the price to remain below 1.0000, and we also need to witness a break of 0.9960 and then 0.9910. From here, the euro is heading to complete the official descending path, waiting to touch 0.9820 and 0.9770, respectively.
Note: The ECB rate decision, press conference, MPC statement, and Fed Chairman’s speech is due today; all could lead to price volatility.
Note: Trading on CFDs involves risks. Therefore, all scenarios may be possible. This article is not a recommendation to buy or sell but rather an explanatory reading of the price movement on the chart.
| S1: 0.9910 | R1: 1.0040 |
| S2: 0.9820 | R2: 1.0085 |
| S3: 0.9770 | R3: 1.0180 |