
The EUR/USD pair continues its gradual decline, aligning with the outlook presented in our previous technical report, and moving closer to the key target at 1.1510.
Technical Outlook:
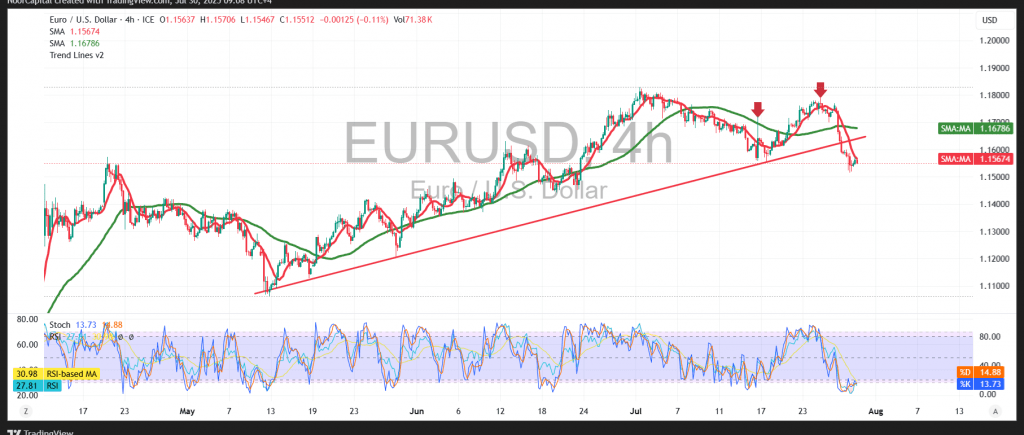
The pair is currently trending lower after breaking below the 1.1580 support level. A closer look at the chart reveals mild bullish signals from the Relative Strength Index (RSI), with early signs of a potential positive crossover, which may support short-term recovery attempts.
However, upward momentum remains limited, as the 50-period Simple Moving Average continues to act as dynamic resistance, weighing on the price. This coincides with a confirmed break of the ascending trendline, which further reinforces the bearish technical structure.
Probable Scenario:
As long as the price remains below the 1.1590 resistance level—and more significantly, below 1.1630—the bearish outlook remains valid. The pair is expected to continue toward the initial target at 1.1510, followed by the next support zone near 1.1445.
Alternative Scenario:
A decisive break above the 1.1630 resistance level and sustained trading above it could trigger a temporary corrective rebound, with initial upside potential toward 1.1705.
Key Risk Events – Caution Advised:
Today, traders should be on high alert as the market awaits a series of high-impact U.S. economic releases, including:
- Non-Farm Employment Change (ADP)
- Quarterly GDP data
- Federal Reserve interest rate decision
- FOMC statement
- Press conference by Fed Chair Jerome Powell
These events could lead to significant market volatility.
Warning:
Risk levels remain elevated amid persistent trade and geopolitical tensions. Sharp price fluctuations are possible, and all scenarios should be considered.
Warning: Trading CFDs carries risk. This analysis is not a recommendation to buy or sell, but an illustrative interpretation of chart movements.
| S1: |