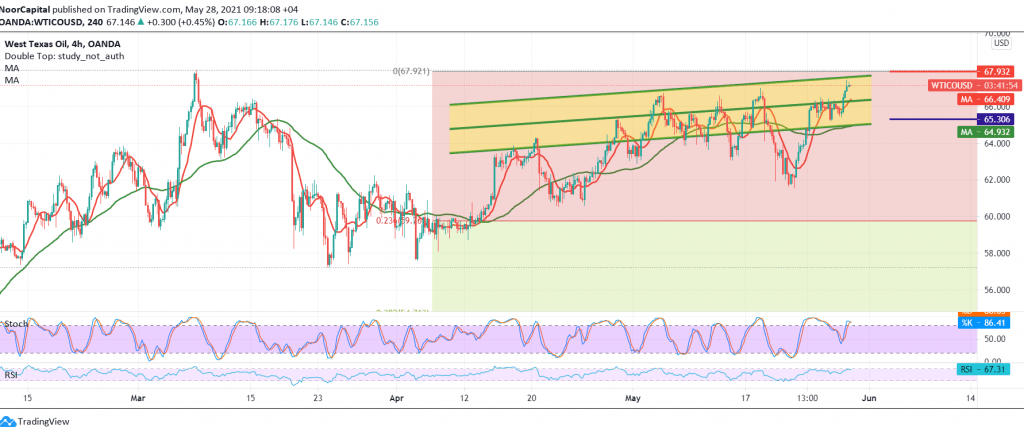
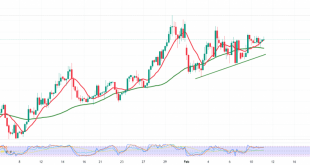
Negative trading dominated the movements of US crude oil futures, after finding a strong level around 67.50, which forced it to retest the 66.15 support.
Technically, and carefully looking at the 60-minute chart, we find that the RSI is trading around the neutrality zone, and by moving to the 4-hour chart, we find signs of negativity that started to appear on the stochastic indicator and started to gradually lose the bullish momentum.
That will make us tend to the negativity, targeting 66.00 as the first target, and breaking it will lead the price directly towards 65.40. From above, the stability of trading above the resistance level of 67.30/67.35 will invalidate the activation of the expected bearish bias, and we are witnessing a recovery in oil prices with initial targets starting at 68.00/68.10 and extending later towards 68.70.
| S1: 66.00 | R1: 67.35 |
| S2: 65.40 | R2: 68.10 |
| S3: 64.60 | R3: 68.70 |
 Noor Trends News, Technical Analysis, Educational Tools and Recommendations

