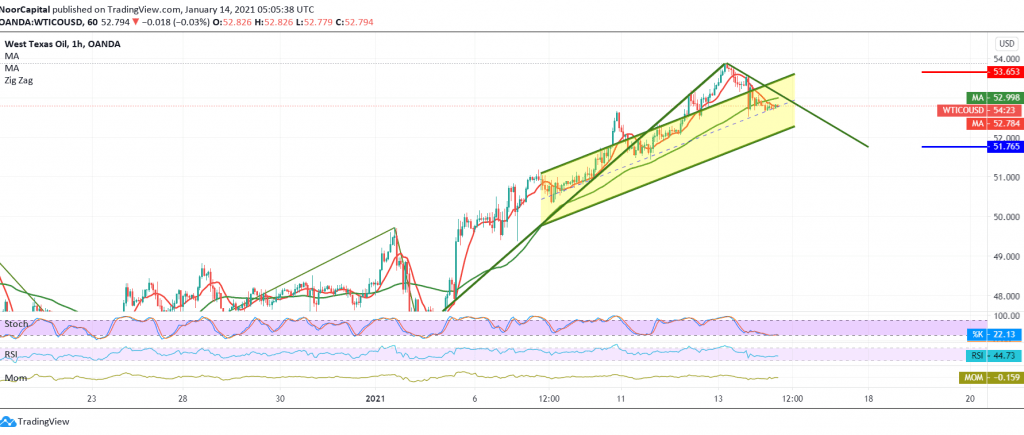
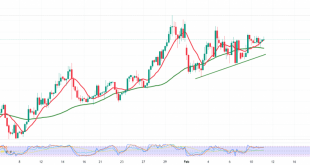
Positive trading dominated the movements of US crude oil futures, touching the target to be achieved during the previous analysis, at 53.90, recording its highest level of 53.86.
Technically, the current moves are witnessing a slight bearish tendency as a result of approaching the psychological barrier resistance level of 54.00, and by looking at the 60-minute chart, we find the RSI indicator started to get a bearish momentum, this comes in conjunction with the clear negative signs on the stochastic indicator.
We tend to the intraday negativity, targeting a retest of 52.30 / 52.20, a first target, knowing that breaking the aforementioned level puts the price under negative pressure to complete the bearish intraday path with the next target of 51.70.
A rise above 53.60 will immediately stop the aforementioned descending attempts and lead oil to the official bullish path, heading for a visit of 54.40.
Note: the slight bearish trend does not contradict the general bullish trend.
| S1: 52.25 | R1: 53.60 |
| S2: 51.70 | R2: 54.40 |
| S3: 50.90 | R3: 54.90 |
 Noor Trends News, Technical Analysis, Educational Tools and Recommendations

