
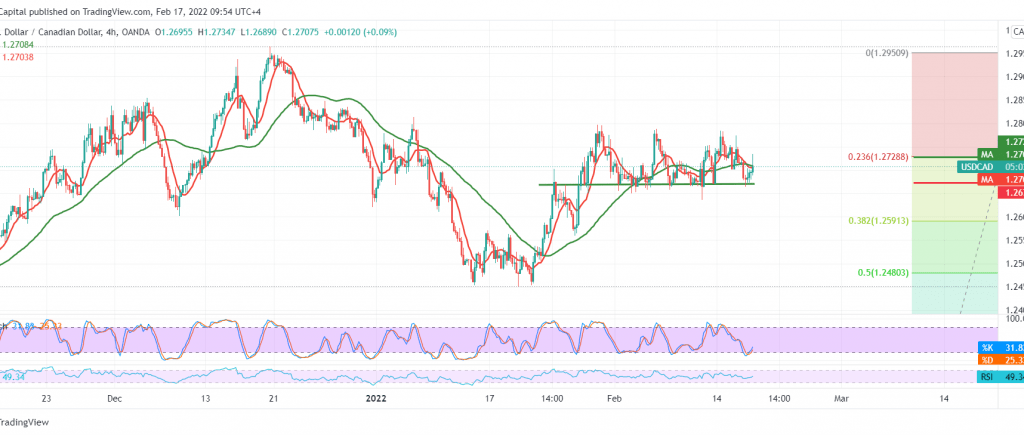
The support levels published during the previous analysis, at 1.2665, managed to limit the bearish bias that occurred during the middle of the last session’s trading, which contributed to pushing the price higher above the 1.2700 level.
Technically, by looking at the 4-hour chart, we notice the positive crossover signs that started appearing on the stochastic indicator, accompanied by the positive signs of the 14-day momentum indicator on the short time frames.
Therefore, there may be a possibility of a bullish bias, knowing that trading above 1.2730, 23.60% correction. This catalyst may push the loonie towards 1.2770, and it may extend later to visit 1.2800 as long as the price is stable above the pivotal support floor 1.2665.
Breaking 1.2665 may cause a strong bearish bias and constitute a negative pressure factor for a visit to 1.2590.
Note: Trading on CFDs involves risks. Therefore, all scenarios may be possible. This article is not a recommendation to buy or sell but rather an explanatory reading of the price movement on the chart.
| S1: 1.2665 | R1: 1.2730 |
| S2: 1.2620 | R2: 1.2770 |
| S3: 1.2590 | R3: 1.2810 |


