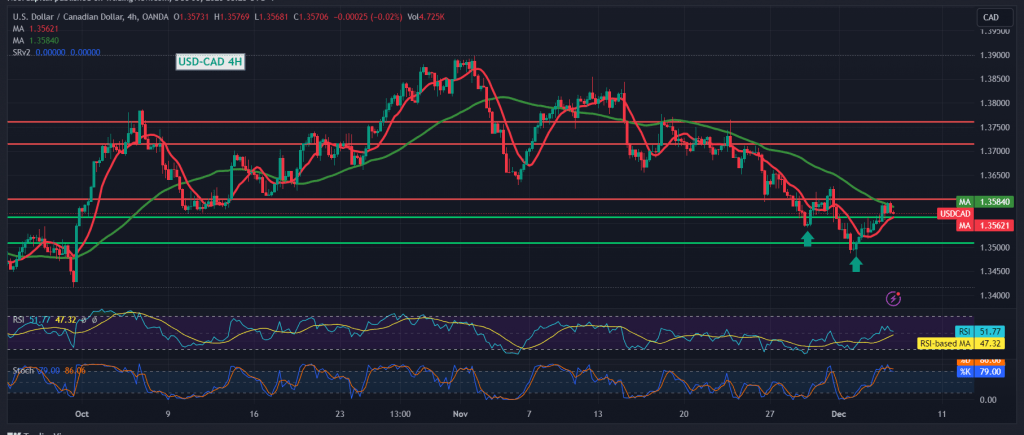
In the aftermath of our previous technical report, the Canadian dollar achieved the initial target at 1.3585, reaching its highest point at 1.3594. Today’s technical analysis, focused on the 4-hour time frame chart, reveals momentary negative movements attributed to the looming resistance of the psychological barrier at 1.3600. This level coincides with the 50-day simple moving average, adding substantial strength. Notably, the Stochastic indicator is showing efforts to dispel negative signals, and intraday trading remains stable above 1.3540.
There exists the potential for a continued upward trend initiated yesterday, contingent upon a clear and robust breach of the 1.3600 resistance level. Such a breakthrough acts as a catalyst, enhancing the likelihood of reaching the first target at 1.3625, followed by the official target at 1.3660.
Conversely, a return to trading stability below 1.3540, confirmed by the closing of at least an hour candle, introduces temporary negative pressure. The aim in this scenario is to retest 1.3500 before potential renewed attempts at an ascent.
Investors are advised to exercise caution today, given the anticipation of high-impact economic data from the American economy, particularly the “change in private non-agricultural sector jobs” from Canada. Additionally, the interest statement and rate decision from the Bank of Canada, coupled with the press talk by the Governor of the Bank of England, may contribute to increased price fluctuations.
The market’s risk level remains elevated amidst ongoing geopolitical tensions, prompting a potential surge in price volatility. Traders are encouraged to stay informed, exercise prudence, and remain adaptable in response to dynamic market conditions.
Note: The level of risk is high amid continuing geopolitical tensions, and we may witness high price volatility.
Note: Trading on CFDs involves risks. Therefore, all scenarios may be possible. This article is not a recommendation to buy or sell but rather an explanatory reading of the price movement on the chart.
| S1: |
 Noor Trends News, Technical Analysis, Educational Tools and Recommendations

