The Canadian dollar failed to retest the resistance of 1.2640 as we expected. Instead, we relied on the positive signs on the momentum indicator, explaining the idea of retesting the general bearish trend, recording the lowest price at 1.2565.
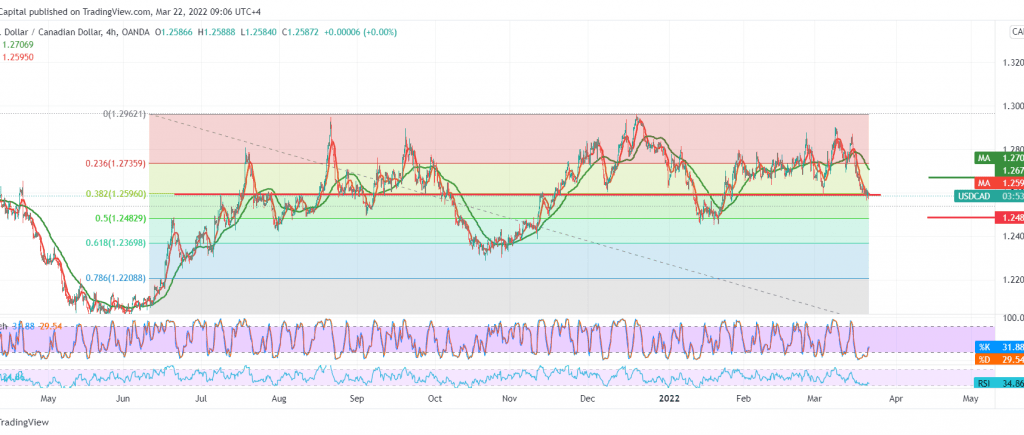
Technically, by looking at the 240-minute chart, we notice that the pair started to pressure the 1.2585 support level accompanied by the continuation of the negative pressure coming from the 50-day moving average.
Accordingly, the pair may reinforce the idea of movement within the bearish direction to visit 1.2560 and 1.2530 respectively, and the bearish targets may extend to visit 1.2480, 50.0% correction, next station, as long as the intraday trades are stable below the 1.2640 resistance.
Note: The risk level is high and we may see random.
Note: Trading on CFDs involves risks. Therefore, all scenarios may be possible. This article is not a recommendation to buy or sell but rather an explanatory reading of the price movement on the chart.
| S1: 1.2560 | R1: 1.2640 |
| S2: 1.2530 | R2: 1.2670 |
| S3: 1.2500 | R3: 1.2700 |
 Noor Trends News, Technical Analysis, Educational Tools and Recommendations


