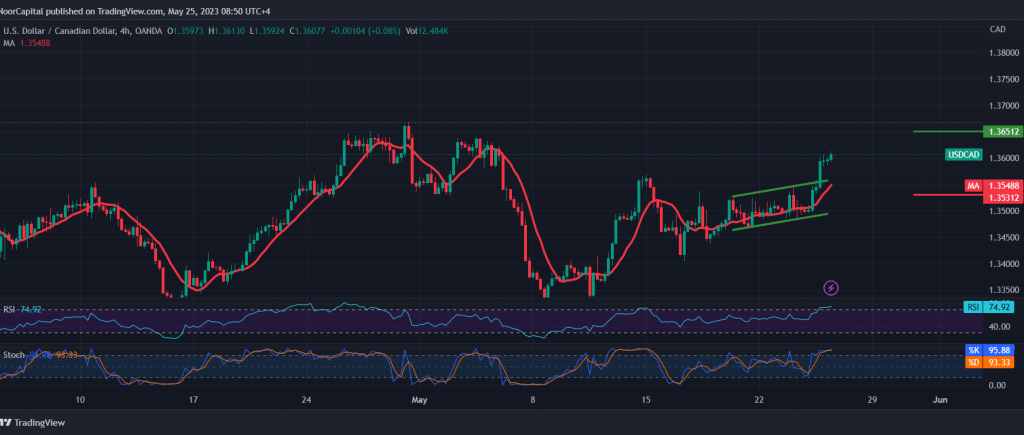
Due to conflicting negative signals, we adhered to intraday neutrality in the previous report, explaining that activating buying centres depends on breaching 1.3500 to target areas of 1.3570, surpassing the required target, and recording its highest level at 1.3613.
Technically, and with a closer look at the 4-hour chart, the simple moving averages returned to hold the price from below. We also find that the relative strength index continues to provide positive signals.
The daily trend is bullish, and targets start at 1.3650 as a first target, and breaching it increases and accelerates the strength of the bullish trend to visit 1.3690 next station, whose targets may extend later towards 1.3730 as long as trading is stable above 1.3540.
Closing the hourly candlestick below 1.3535, the previously breached resistance that turned it into a support level, delaying the chances of a rise, and we may witness some negative pressure to retest 1.3455.
Note: Today, we are awaiting high-impact economic data issued by the US economy, “the preliminary reading of the Gross Domestic Product,” quarterly, and we may witness a high fluctuation in prices.
Note: Trading on CFDs involves risks. Therefore, all scenarios may be possible. This article is not a recommendation to buy or sell but rather an explanatory reading of the price movement on the chart.
| S1: |
 Noor Trends News, Technical Analysis, Educational Tools and Recommendations

