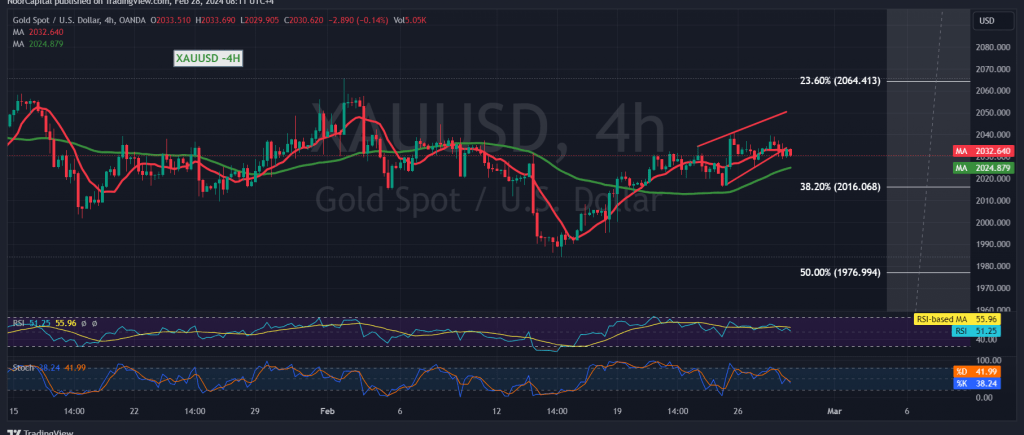
Gold prices encountered downward pressure during the preceding trading session following their ascent to the 2040 resistance level. This led to a decline, resulting in intraday movements stabilizing around the lowest level for the current period, priced at $2030.
Today’s technical analysis, upon examination of the 4-hour timeframe chart, reveals gold prices maintaining stability above the primary support corresponding to the 2016 trading levels, marked by the 38.20% Fibonacci retracement. Additionally, the simple moving averages persist in supporting the upward trajectory of prices.
As long as the price maintains intraday levels above $2025, and overall sustains positive stability above the primary support floor for the 2016 trading levels, represented by the 38.20% Fibonacci retracement, the upward trend remains intact and effective. Notably, consolidation above $2035 serves as a motivating factor, augmenting the likelihood of an ascent towards $2042 and $2055, respectively. Further gains may extend towards $2065, marking the official station of the ongoing upward wave.
It is crucial to emphasize that a failure to maintain positive stability above $2016 could subject the price to initial negative pressure, with initial targets set at $2004 and $1993. Furthermore, it is pertinent to note that the official target stands at $1977 should a corrective decline ensue.
A word of caution: Today’s trading activity is influenced by the impending release of high-impact economic data from the American economy, specifically the preliminary reading of the gross domestic product – quarterly. Consequently, heightened volatility is anticipated at the time of the news release.
Note: Trading on CFDs involves risks. Therefore, all scenarios may be possible. This article is not a recommendation to buy or sell but rather an explanatory reading of the price movement on the chart
| S1: |
 Noor Trends News, Technical Analysis, Educational Tools and Recommendations

