
During the previous trading session, the Euro/Dollar pair witnessed predominantly positive trades, aligning with the anticipated bullish trajectory towards the official target of 1.0860. The pair reached its highest level at 1.0840, reflecting the strength of the upward movement.
Technical Analysis Outlook
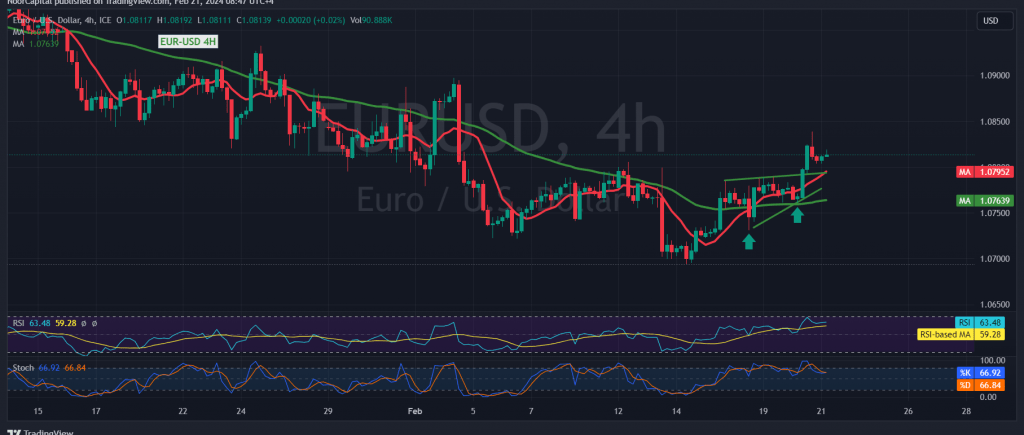
From a technical standpoint today, examining the 4-hour time frame chart reveals that the 50-day simple moving average is providing support for the upward price trend. Furthermore, the pair successfully breached the resistance level at 1.0765, which has now turned into a support level following the principle of role reversal.
Forward Expectations
Maintaining stability in trading above the 1.0765 support level is seen as encouraging for sustaining positive expectations. The initial official target remains at 1.0860, with the consolidation of prices above this level expected to further strengthen the upward trend. A breach above this level could pave the way for further gains towards 1.0960.
Potential Downside Risks
However, a return to trading stability below the aforementioned support level of 1.0765 would signal a halt in the upward movement, potentially leading the pair towards the official bearish path. Initial targets in this scenario include retesting levels at 1.0720 and 1.0680.
Market Caution
Investors should exercise caution today, as high-impact economic data from the American economy, particularly the results of the Federal Reserve Committee meeting, could lead to increased price volatility during the release of news.
Conclusion
Overall, the Euro/Dollar pair continues to exhibit positive momentum, with technical indicators and support levels suggesting further upward movement. However, market participants should remain vigilant given the potential impact of upcoming economic data releases on price fluctuations.
Note: Trading on CFDs involves risks. Therefore, all scenarios may be possible. This article is not a recommendation to buy or sell but rather an explanatory reading of the price movement on the chart.
| S1: |