
In the recent trading session, gold prices exhibited a pattern of short-term sideways movement with a bullish bias, aligning with previous technical analyses that highlighted the significance of surpassing the $2040 threshold. Notably, gold reached its pinnacle at $2044 per ounce, signaling upward momentum.
Technical Insights: Balancing Negative Pressure with Positive Indicators
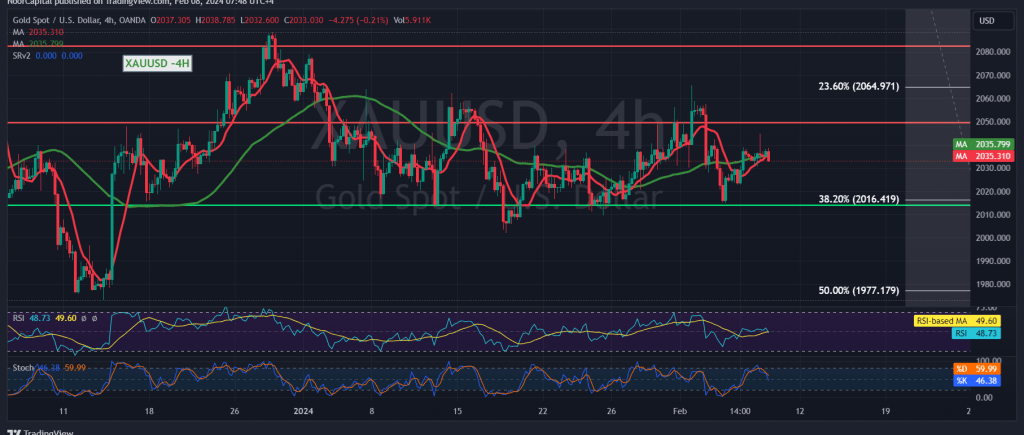
A meticulous examination of the 240-minute interval chart unveils limited downward pressure on gold prices. Despite this, the Stochastic indicator is actively striving to shed immediate negative signals, buoyed by encouraging endeavors from the 14-day Momentum indicator, hinting at a potential increase in momentum.
Maintaining Optimism Amidst Technical Conditions
Our outlook remains optimistic, underpinned by favorable technical conditions. Sustained price consolidation above key levels, particularly $2035 and crucially $2040, serves as a catalyst for further upside potential. Such stability enhances the likelihood of gold ascending towards $2047, the initial target, followed by $2056, the subsequent milestone.
Upholding Bullish Momentum Amidst Fibonacci Levels
We continue to favor the prevailing upward trend, emphasizing the importance of maintaining stability above $2016, corresponding to the 38.20% Fibonacci retracement level. A breach of this level would stall upward endeavors, potentially triggering a robust downward correction. Downside targets in such a scenario hover around $1977, aligning with the 50.0% correction level.
Warning: Heightened Risk Amid Geopolitical Uncertainties
It’s imperative to acknowledge the elevated risk level, especially amidst ongoing geopolitical tensions, which may amplify price volatility. Traders are urged to exercise caution and implement appropriate risk management strategies to navigate potential fluctuations effectively.
By incorporating these technical insights and remaining vigilant amid evolving market dynamics, traders can navigate the intricacies of the gold market with greater confidence.
Note: Trading on CFDs involves risks. Therefore, all scenarios may be possible. This article is not a recommendation to buy or sell but rather an explanatory reading of the price movement on the chart
| S1: |