
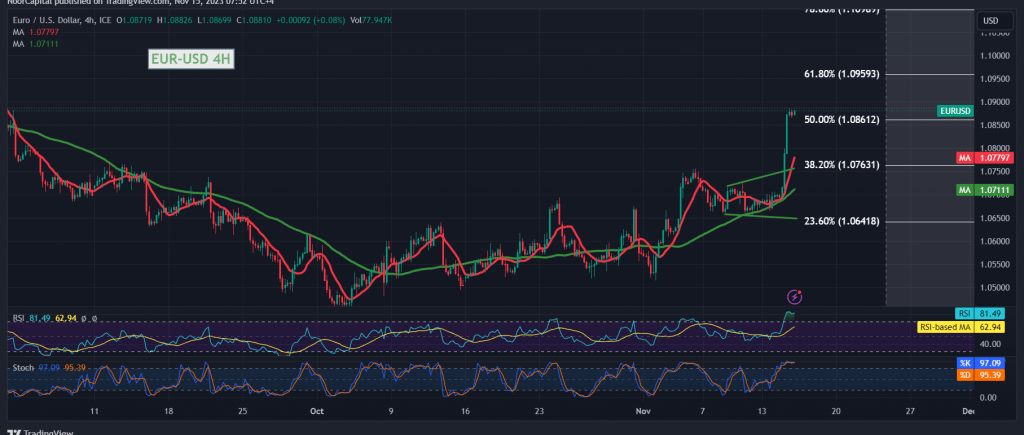
In the last trading session, the Euro enjoyed a surge against the US Dollar, capitalizing on the latter’s fall following inflation data. This defied the bearish scenario we had anticipated, based on trading stability free from the psychological resistance barrier of 1.0700 at the time of the report. It seems that any trading above 1.0760 will halt decline attempts, causing the pair to start trending upwards. An upward correction is underway, aiming initially at 1.0800 and 1.0840, with a peak recorded at 1.0887, effectively balancing out short position losses.
A detailed look at the pair’s technical analysis today, focusing on the 4-hour timeframe, reveals it is momentarily stable above the 1.0860 resistance, symbolized by the 50.0% Fibonacci retracement. The trading stability is largely due to the previously breached resistance, which has now become a support level at 1.0760, marking a 38.20% correction. The Simple Moving Averages further back up the daily upward price curve.
Therefore, the potential for the upward trend to continue remains valid and potent, with a primary target set at 1.0960, indicating a 61.80% correction. Breaching this level could lead to an extension of gains as 1.1015 is our next station.
However, a minimum one-hour candle closure below 1.0860 could apply pressure on the pair, prompting a retest of 1.0800 and 1.0760 prior to any new upward attempts.
A note of caution: the Stochastic indicator is nearing overbought zones, and we might observe some fluctuation before settling into an official trend.
Another note of caution: we anticipate high-impact economic data from the American economy today, with the release of the Producer Price Index, Retail Sales, and New York State Manufacturing Index. From the British economy, we expect the Annual Consumer Prices. These releases may cause significant price fluctuations.
Note: Trading on CFDs involves risks. Therefore, all scenarios may be possible. This article is not a recommendation to buy or sell but rather an explanatory reading of the price movement on the chart.
| S1: |