
Positive trading dominated the movements of the USD/JPY pair yesterday, approaching by a few points to the target published in the previous technical report at 148.00, only to post its highest price of 147.87.
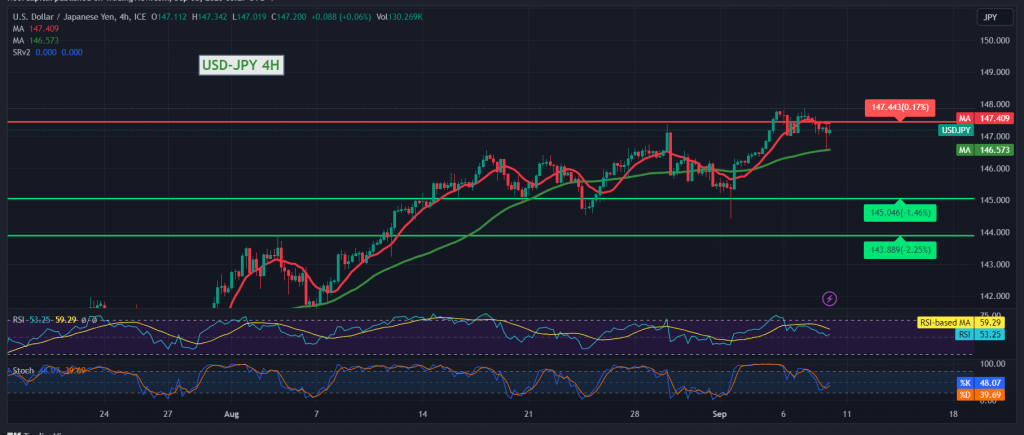
On the technical side, the pair witnessed a rapid decline after attempts to approach the resistance level of the psychological barrier of 148.00, which forced it to retest the support level of 146.60. With a closer look at the chart with a time interval of 240 minutes, we find that the pair has returned to stability above 147.00 and is still stable above the 50-day simple moving average. Stochastic is also trying to get rid of the intraday negativity.
From here, with the stability of intraday trading above 147.00 and generally above 146.60, the bullish scenario remains valid and effective, targeting 148.00. The price behavior of the pair must be monitored at the mentioned level because breaching it is a motivating factor that enhances the pair’s gains, so we are waiting for 148.35 and 148.70 as official awaited stations.
From below, the return of daily trading stability below 146.60 postpones the chances of a rise, but does not cancel them, and we may witness a retest of 146.00 before the rise begins again.
Note: The Stochastic indicator has begun to provide temporary negative signals, and we may witness fluctuation until the desired official direction is obtained.
Note: Trading on CFDs involves risks. Therefore, all scenarios may be possible. This article is not a recommendation to buy or sell but rather an explanatory reading of the price movement on the chart.
| S1: |