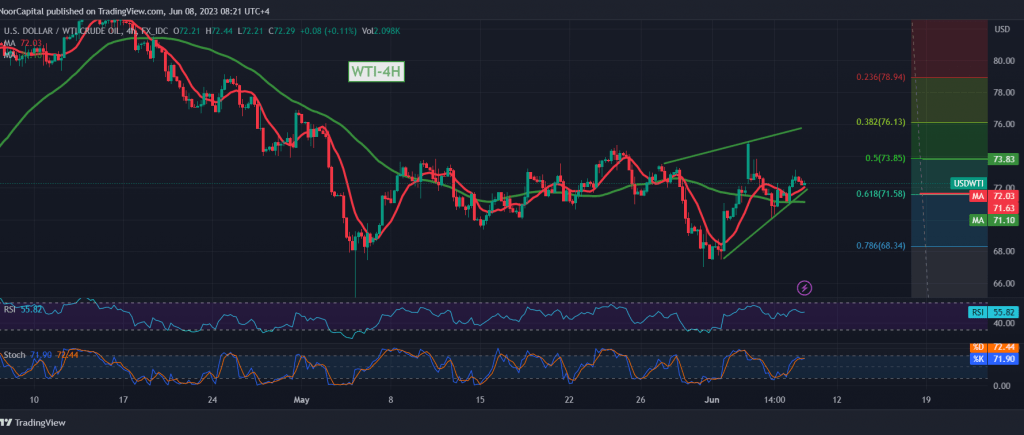
US crude oil futures prices reversed the expected bearish trend during the previous analysis, touching the stop loss order at 71.55, explaining that the price’s consolidation above the resistance above level can turn the daily trend into an upward one, targeting 72.45 and 73.40, recording its highest level at $73.15 per barrel, compensating Selling position losses.
Technically, by looking at the 4-hour chart, we find that the oil price has returned to stability above the pivotal support floor located at 71.55, represented by Fibonacci correction 61.80%, accompanied by the return of the simple moving averages to carry the price from below, which supports the possibility of a rise. On the other hand, we find the stochastic indicator around overbought areas.
With the main technical signals conflicting, we prefer to monitor the price behavior to be in front of one of the following scenarios:
To complete the bullish path that started yesterday, we must witness a clear and strong breach of the resistance level of 73.80. This motivating factor enhances the chances of visiting 83.85, 50.0% Fibonacci correction.
Breaking 71.55, leads the price to the downside path again, targeting 70.10 initially.
Note: The risk level is high and all scenarios are likely to occur.
Note: Trading on CFDs involves risks. Therefore, all scenarios may be possible. This article is not a recommendation to buy or sell but rather an explanatory reading of the price movement on the chart.
| S1: |
 Noor Trends News, Technical Analysis, Educational Tools and Recommendations

