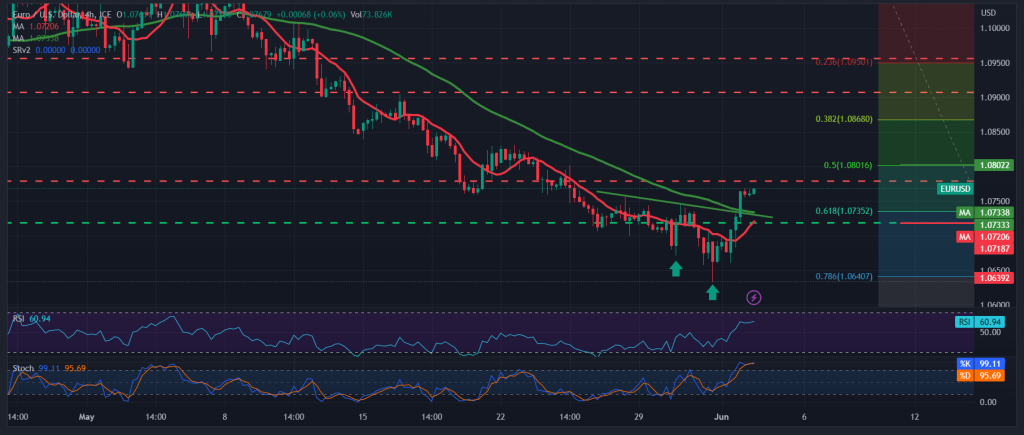
Trading tended to be positive, dominating the movements EURUSD pair during the previous trading session, benefiting from touching the last target around the 1.0640 support floor, to start a bullish rebound, to reflect the expected bearish trend yesterday, in which we relied on trading stability below the main resistance 1.0740, explaining that the closing of the 4-hour candlestick Above 1.0740, it can thwart the suggested bearish scenario. The pair starts attempting an upward correction, with targets starting at 1.0800/1.0790, reaching its highest level at 1.0770.
On the technical side today, by looking at the 240 interval chart, the euro’s movements are witnessing intraday stability above 1.0740, Fibonacci retracement 61.80, and we find the simple moving averages returned to hold the price from below, and support the possibility of an upward impulse, stimulated by the clear positive signs on the RSI.
With the stability of intraday trading above 1.0730, and in general, above 1.0695, the movements of the euro-dollar pair may witness a bullish bias, targeting 1.0800/1.0790 Fibonacci correction of 50.0%. The price behaviour of the pair should be monitored around this level, because its breach is a catalytic factor that enhances the chances of a rise towards 1.0860, a correction of 38.20%, as shown on the chart.
From below, decline below 1.0695 will immediately stop the bullish impulse attempts that started in the previous session, and lead the pair to the official bearish path. We await targets around 1.0625 & 1.0580.
Note: Stochastic around overbought areas.
Note: Today we are awaiting high-impact economic data issued by the US economy “US jobs data”, “average wages” and US unemployment rates, and we may witness a high fluctuation in prices at the time of the news release.
Note: Trading on CFDs involves risks. Therefore, all scenarios may be possible. This article is not a recommendation to buy or sell but rather an explanatory reading of the price movement on the chart.
| S1: |
 Noor Trends News, Technical Analysis, Educational Tools and Recommendations

