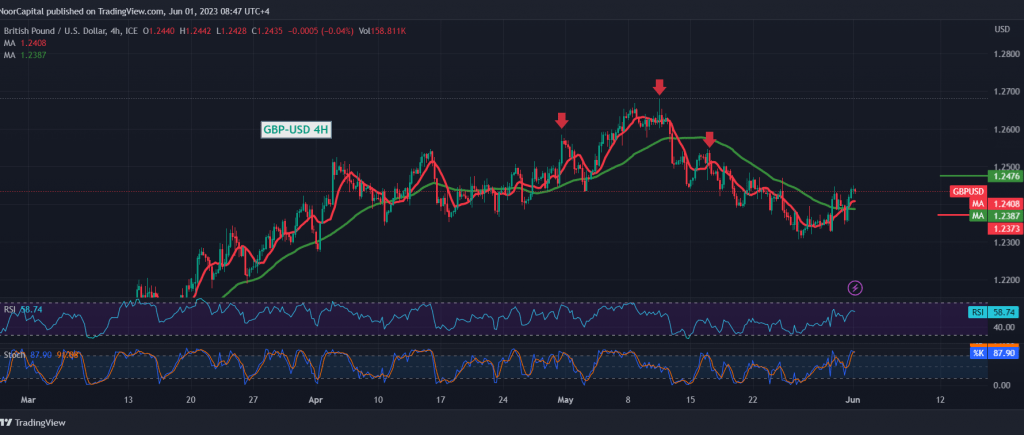
For the second session in a row, GBPUSD are witnessing attempts to rise. However, there are still limited upward attempts aimed at retesting the main resistance of the current trading range at 1.2440.
On the technical side, by looking at the 240-minute chart, we find the effect of the bearish technical pattern shown on the 4-hour chart still valid and active, and we find the stochastic started to provide negative signals and is gradually losing bullish momentum, indicating the return of the bearish context again.
From here, with steady daily trading below 1.2470/1.2450, that encourages us to hold onto our negative expectations, targeting 1.2375, noting that breaking it will facilitate the task required to visit 1.2310 and 1.2275, respectively.
Only from above, the return of trading stability again above 1.2470, and the closing of the 4-hour candlestick above it, can ultimately thwart the bearish scenario and lead the pair to recover towards 1.2515 and 1.2580 later.
Note: Today, we are awaiting high-impact economic data issued by the US economy, “the change in private sector jobs,” and the “manufacturing purchasing managers” index, in addition to the report issued by the International Energy Agency regarding oil inventories and we may witness high volatility in prices at the time of the news release.
Note: Trading on CFDs involves risks. Therefore, all scenarios may be possible. This article is not a recommendation to buy or sell but rather an explanatory reading of the price movement on the chart.
| S1: |
 Noor Trends News, Technical Analysis, Educational Tools and Recommendations

