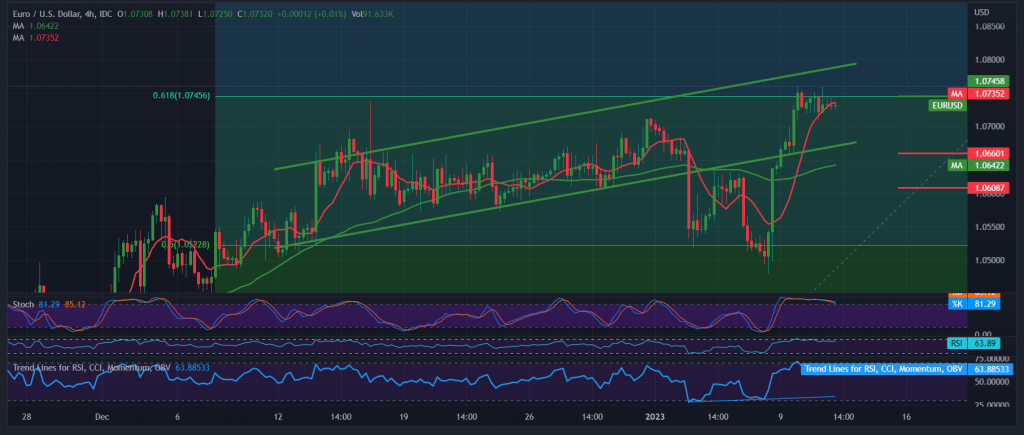
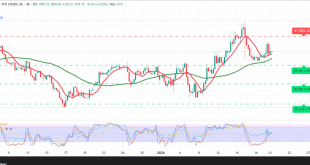
The euro-dollar pair did not show strong movements during the previous trading session, as part of its attempts to breach the strong supply zone published in all technical reports for the current week at the price of 1.0740, representing the key to the continuation of the bullish trend.
On the technical side today, the 50-day SMA is still supporting the daily bullish price curve, stimulated by the clear positive signs on the momentum indicator in the 60-minute time frame, in addition to the regular work inside the ascending channel.
Despite the technical factors that indicate the possibility of the continuation of the bullish trend, we need to witness the price consolidation above the pivotal resistance level 1.0740 represented by Fibonacci correction 61.80%, as shown on the chart, to enhance the chances of rising towards 1.0780 as the first target, and then 1.0830 as a next station.
Suppose the pair fails to surpass the resistance above, and returns to trading below 1.0695, and most importantly 1.0660, from here. In that case, the pair may start trading with negativity, to be waiting to touch 1.0610 initially.
Note: Stochastic is shifting overbought areas.
Note: Trading on CFDs involves risks. Therefore, all scenarios may be possible. This article is not a recommendation to buy or sell but rather an explanatory reading of the price movement on the chart.
| S1: 1.0695 | R1: 1.0780 |
| S2: 1.0660 | R2: 1.0830 |
| S3: 1.0610 | R3: 1.0900 |
 Noor Trends News, Technical Analysis, Educational Tools and Recommendations

