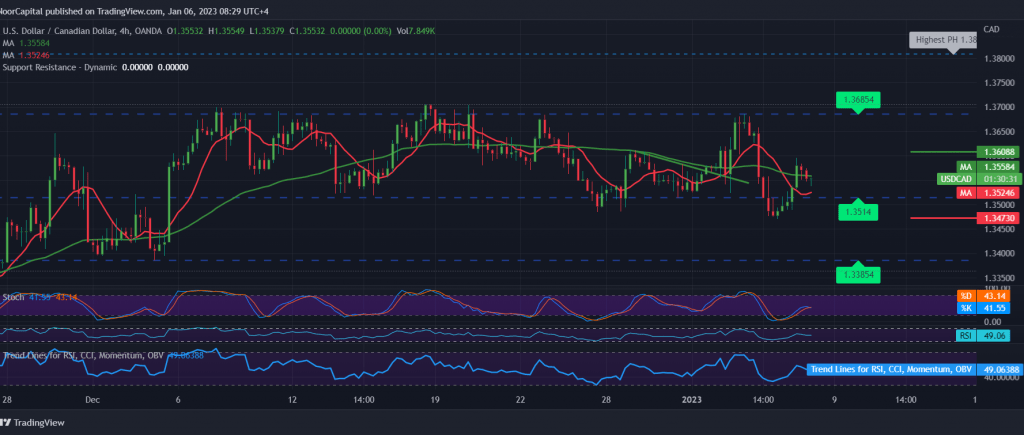
Negative trading dominated the movements of the Dow Jones industrial index on Wall Street, after it failed to maintain positive stability above 33,030, explaining that the infiltration below 33,030 puts the index under strong negative pressure to target 32,840, recording its lowest level at 32,806.
Technically, the simple moving averages continue the negative pressure on the price from above. However, this comes in conjunction with the stability of the relative strength index below the middle line, which contradicts the positive signs that began to appear on the stochastic.
We prefer to monitor the price behavior to be in front of one of the following scenarios:
To get an upward trend, we need stability above 32,840, and we need to see the price consolidate above 33,090, which may open the door for the index to record gains that start at 33,130 and 33,330.
Below 32,800, the negative pressure on the index begins again, as we are waiting to touch 32,550.
Note: Today, we are awaiting high-impact data issued from the United States of America, “American jobs data, average wages and unemployment rates,” and we may witness high volatility at the time of the news.
Note: Trading on CFDs involves risks. Therefore, all scenarios may be possible. This article is not a recommendation to buy or sell but rather an explanatory reading of the price movement on the chart.
| S1: |
 Noor Trends News, Technical Analysis, Educational Tools and Recommendations

