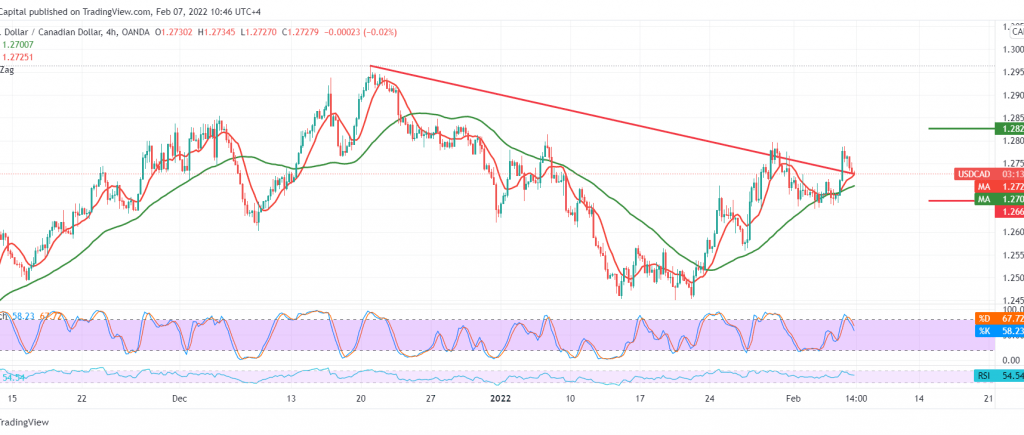
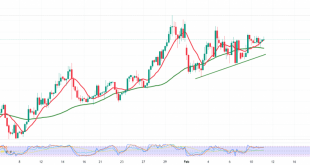
The Canadian dollar achieved noticeable gains during last week’s trading, within the expected bullish path, after it succeeded in breaching the resistance level 1.2710, to reach the highest level at 1.2787.
Technically, and carefully looking at the 240-minute chart, we note the current negativity features that started appearing on the stochastic indicator, in addition to the negative signals coming from the RSI on the short intervals.
There is a possibility of a bearish bias during the hours to retest 1.2690 and 1.2665, respectively, considering that the consolidation above the 1.2760 resistance level leads the pair to recover again to visit 1.2790 1.2830 initially.
Note: Trading on CFDs involves risks. Therefore, all scenarios may be possible. This article is not a recommendation to buy or sell but rather an explanatory reading of the price movement on the chart.
| S1: 1.2665 | R1: 1.2790 |
| S2: 1.2605 | R2: 1.2850 |
| S3: 1.2540 | R3: 1.2915 |
 Noor Trends News, Technical Analysis, Educational Tools and Recommendations

