The European single currency declined noticeably against the US dollar for two consecutive sessions, reaching as low as 1.1890.
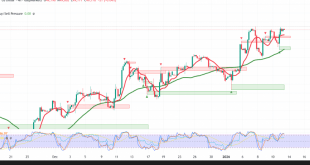
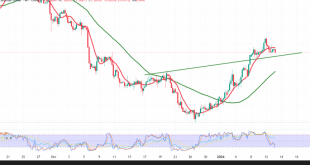
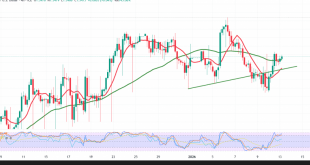
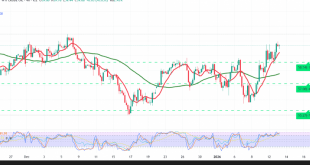
On the technical side, and with a closer look at the 4-hour chart, we find the current moves are showing some bullish bias but still limited.
The simple moving averages continue to pressure the price from above, accompanied by the RSI’s continued defense of the bearish trend. From here and steadily trading below the previously broken support, which is now turned to the 1.1960/1.1970 resistance level, 50.0% correction.
The bearish scenario remains valid and effective, provided we confirm breaking 1.1880 represented by the 61.80% Fibonacci correction, paving the way for a visit to 1.1820, and then 1.1750.
Skipping up and rising again above 1.1970/1.1980 will postpone the chances of a decline, but it does not cancel them, and we may witness a slight bullish slope that aims to retest 1.2050.
| S1: 1.1865 | R1: 1.1980 |
| S2: 1.1820 | R2: 1.2050 |
| S3: 1.1750 | R3: 1.2100 |
 Noor Trends News, Technical Analysis, Educational Tools and Recommendations


