Dow Jones Industrial Average (DJIA) Technical Analysis
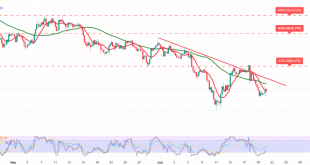
The Dow Jones Industrial Average on Wall Street retreated after encountering formidable resistance in the vicinity of 51,650 — a level that forced the index into a downside move.
Technical Outlook for Today’s Session – 4-Hour Timeframe:
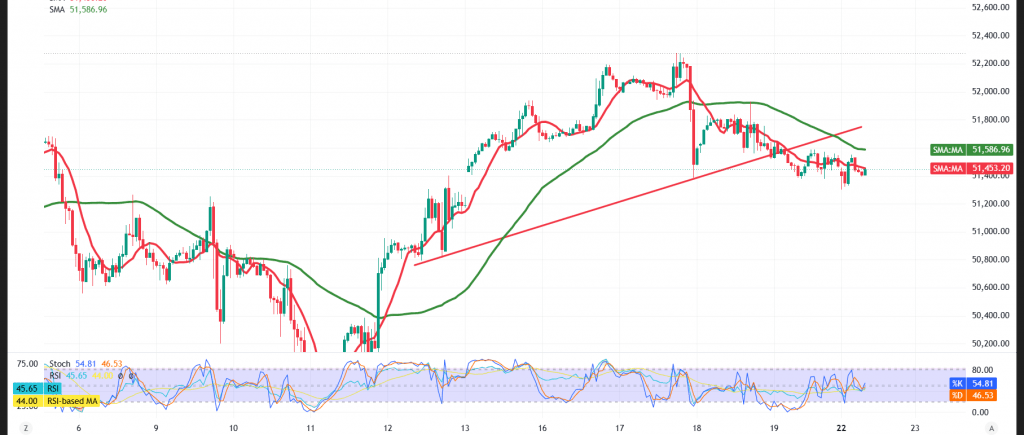
On the short-term horizon, the simple moving averages have resumed their downward pressure on the price, with the 50-period moving average converging near 51,630 — a confluence that lends additional weight to this bearish posture.
The Relative Strength Index (RSI) is likewise broadcasting clear negative signals, mirroring the gradual deterioration in bullish momentum — a configuration that lends support to a resumption of the decline.
The current technical readings confirm that the downtrend remains the most probable scenario, as long as the index continues to languish beneath the key resistance levels.
Bearish (Most Likely) Scenario:
As long as trading remains capped beneath the 51,630 resistance ceiling, the continuation of the decline will retain the upper hand, with targets set at:
- 51,275 as the initial objective
- Followed by 51,110 as the subsequent level
Bullish Scenario:
Conversely, a confirmed break above 51,630 could enable the index to mount a recovery toward 51,820 as the initial upside target.
Risk Alert: Risk levels remain elevated amid persistent trade frictions and geopolitical tensions — all scenarios should be considered plausible.
Trading in CFDs involves risks, and therefore all scenarios are subject to potential outcomes. The analysis provided above is not a recommendation to buy or sell but rather an illustrative reading of price action on the chart.
| S1: 51275 | R1: 51630 |
| S2: 51110 | R2: 51820 |
| S3: 50930 | R3: 51975 |