Gold (XAU/USD) Technical Analysis
Gold prices are mounting an attempt to claw back a portion of their recent losses in the wake of a series of sharp declines that drove the precious metal to a low near $4,022 — a move that comes amid technical efforts to rebuild momentum following the powerful sell-off that dominated trading over the past period.
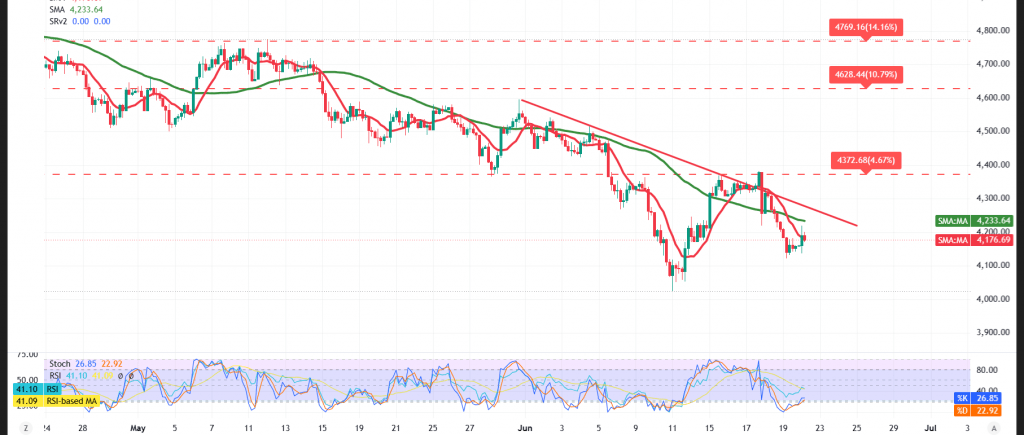
Technical Outlook – 4-Hour Timeframe:
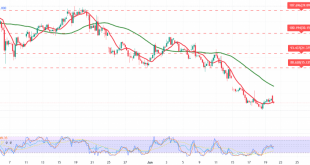
With respect to intraday dynamics, the current price action appears closer to a technical correction aimed at absorbing the previous selling pressure — a perfectly natural development in the wake of the sharp decline that gold has recently endured. The Relative Strength Index (RSI) has likewise started to display initial positive signals that could support the attempts to recapture buying momentum across the upcoming sessions.
That said, prices remain anchored beneath the simple moving averages, which continue to function as robust dynamic resistance barriers — a configuration that preserves the downward bias and frames any current rallies as nothing more than temporary technical corrections, unless the key resistance levels are decisively breached and sustained above.
Bearish (Most Likely) Scenario:
Sustained intraday trading beneath the $4,220 resistance ceiling preserves the bearish bias, with the initial target set at:
- $4,129
A decisive break below this level — coupled with sustained trading beneath it — would accelerate the decline toward:
- $4,080
- Followed by $4,040 as the subsequent target
Bullish Scenario:
This scenario would only be validated should gold deliver a decisive breakout above the $4,220 resistance and sustain trading above it — a development that could ignite a technical rebound toward:
- $4,260
- Followed by $4,309
Disclaimer: Trading gold carries substantial risk and may not be suitable for all investors.
Risk Alert: Risk levels remain elevated amid persistent trade frictions and geopolitical tensions — all scenarios should be considered plausible.
Risk Disclaimer: Trading CFDs involves risks, and therefore all scenarios may be plausible. The content above is not a recommendation to sell or buy but rather an explanatory reading of price movement on the chart.
| S1: 4130.00 | R1: 4220.00 |
| S2: 4080.00 | R2: 4260.00 |
| S3: 4040.00 | R3: 4310.00 |