
Dow Jones Industrial Average (DJIA) Technical Analysis
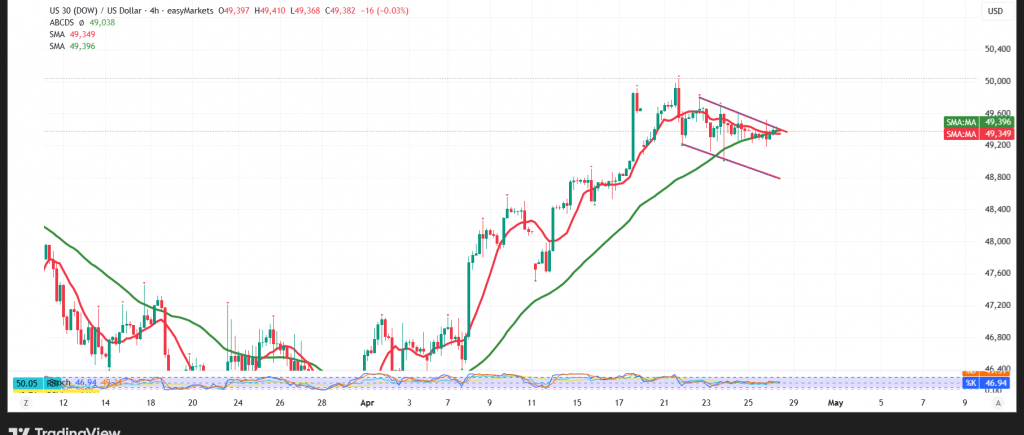
Sideways trading with a mildly bearish undertone has dominated the price action of the Dow Jones Industrial Average on Wall Street, with the index registering an intraday low of 49,190.
Technical Outlook for Today’s Session – 4-Hour Timeframe:
The Relative Strength Index (RSI) is flashing negative signals, lingering below the 50 midline — a reading that mirrors the weakness in underlying momentum. Compounding the bearish picture, the price continues to trade beneath the 50-period simple moving average, reinforcing the downside bias.
Likely Scenario:
From the current juncture, with the index pinned below the 49,540 resistance ceiling, the probability of a renewed downtrend remains on the table — contingent upon a decisive and convincing break beneath the 49,250 support floor. Such a development would unlock the path toward 49,205, and a subsequent breakdown below this level would extend losses toward 49,030.
It is worth highlighting that a recovery above 49,540 could ignite a swift rebound, paving the way toward 49,695 and 49,870 as successive upside targets.
Risk Alert: Risk levels remain elevated amid persistent trade frictions and geopolitical tensions — all scenarios should be considered plausible.
Trading in CFDs involves risks, and therefore all scenarios are subject to potential outcomes. The analysis provided above is not a recommendation to buy or sell but rather an illustrative reading of price action on the chart.
| S1: 49205 | R1: 49540 |
| S2: 49030 | R2: 49695 |
| S3: 48870 | R3: 49870 |


