
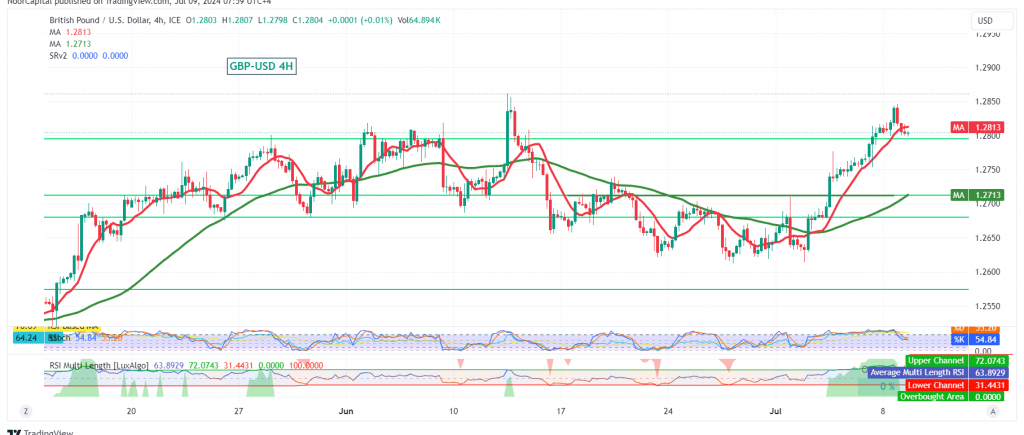
The British pound (GBP) has shown a positive trend against the US dollar (USD), successfully breaking through the pivotal resistance level of 1.2720 and approaching the psychological barrier of 1.2800.
Key Technical Signals:
- Resistance Turned Support: The previously breached resistance at 1.2720 now acts as a solid support level, underpinning the bullish outlook.
- 50-Day SMA Support: The 50-day simple moving average (SMA) provides additional support and reinforces the positive momentum.
- Relative Strength Index (RSI): Clear positive signals on the RSI, coupled with its position above the 50 midline, further confirm the bullish bias.
Upward Potential:
The GBP/USD pair is poised for further upward movement in today’s trading. The initial target is set at 1.2840, followed by 1.2870. A break above 1.2870 could pave the way for a move towards 1.2900.
Downside Risks:
A confirmed break below the 1.2760 level could trigger a temporary bearish reversal, leading to a retest of the 1.2720 support level before the pair potentially resumes its upward trajectory.
Caution:
High-Impact Economic Data: Today’s release of high-impact economic data from the US, including testimony from Fed Chairman Jerome Powell and a speech by the US Treasury Secretary, could introduce significant volatility into the market. Traders should exercise caution during these events.
Overall Assessment:
The technical outlook for the GBP/USD pair remains bullish, with multiple indicators supporting further upward movement. The key levels to watch are 1.2760 on the downside and 1.2840, 1.2870, and 1.2900 on the upside. However, traders should remain mindful of the potential for volatility stemming from upcoming economic data releases.
Disclaimer: Trading in CFDs carries inherent risks. The analysis provided herein is not a recommendation to buy or sell, but rather an interpretation of the current price movement on the chart.
| S1: |