Gold prices (XAU/USD) staged a notable rebound during early trading today, climbing to a high near $5,082 at the time of writing, as the market attempts to recover part of the losses recorded in previous sessions.
Technical Outlook – 4-Hour Chart
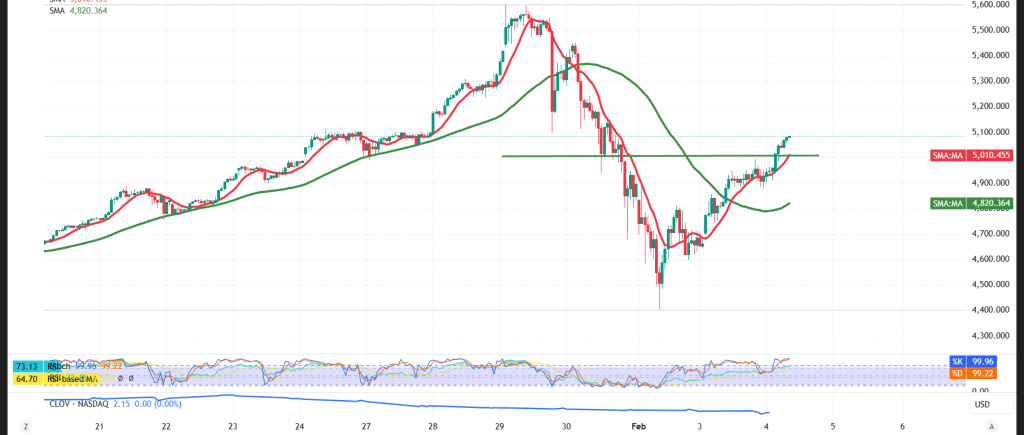
Daily Trend: Still Bearish
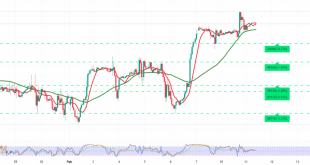
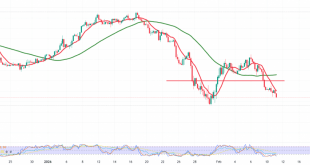
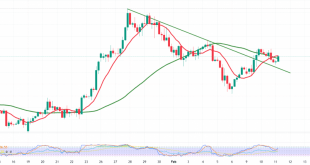
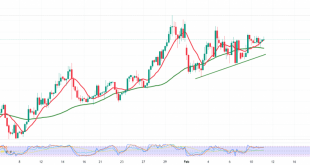
Despite the short-term rebound and price holding above the psychological $5,000 level, the broader daily trend remains bearish. Simple moving averages continue to cap price action from above, acting as dynamic resistance and preserving the short-term downward structure, particularly after the break of the former ascending trendline, as shown on the chart.
Momentum indicators are also starting to weaken. The Relative Strength Index (RSI) has entered overbought territory and is beginning to issue negative signals, suggesting that upside momentum may be losing strength and increasing the likelihood of a corrective pullback in the near term.
Key Technical Scenarios
- Bearish Continuation Scenario:
A confirmed break back below the $5,000 level — which has shifted from resistance to support under the principle of role reversal — would reinforce the bearish corrective trend. In this case, downside targets would stand at $4,890 initially, followed by $4,821. - Recovery Scenario:
A return to price stability above the $5,100 level, confirmed by an hourly candle close, would restore positive momentum and could open the way for further gains toward $5,197 as the next upside target.
Market Note:
High-impact U.S. economic data is due today, including the Non-Farm Private Sector Jobs report and the ISM Services PMI. Elevated volatility is expected around the release.
Risk Warnings:
- Gold trading currently carries a relatively high level of risk and may not be suitable for all investors.
- Ongoing trade and geopolitical tensions continue to increase uncertainty, leaving all scenarios possible.
Risk Disclaimer: Trading CFDs involves risks, and therefore all scenarios may be plausible. The content above is not a recommendation to sell or buy but rather an explanatory reading of price movement on the chart.
| S1: 4821.00 | R1: 5208.00 |
| S2: 4565.00 | R2: 5338.00 |
| S3: 4435.00 | R3: 5595.00 |