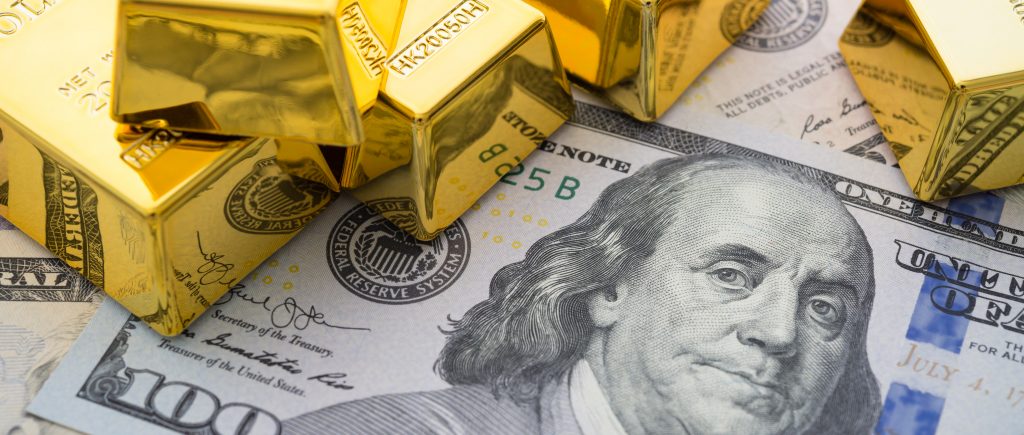
Both spot gold and gold futures are down about -0.70 following the US PCE data released on 31/05/2024, the persistent question now is: “What factors and market drivers have recently impacted the performance of the precious metal?”
Before we dive into the factors affecting their performance, let’s briefly understand the differences between spot gold and gold futures:
Spot Gold:
Refers to the physical metal traded for immediate delivery.
Traded over-the-counter (OTC) without a centralized exchange.
Prices are influenced by supply and demand dynamics, geopolitical events, and investor sentiment.
No fixed contract size or expiration date.
Gold Futures:
Contracts to buy or sell gold at a predetermined price on a specific future date.Traded on centralized exchanges (e.g., COMEX).
Standardized contract sizes and expiration dates.
Allows investors to speculate on gold price movements without physical delivery.
Recent Performance and Market Drivers
1. Economic Data Gold’s Performance
On May 31, 2024, gold futures retreated -0.72% and traded at $2,326.97 per ounce, while spot gold retreated -0.69% and traded at $2,327.20 per ounce. This dip was primarily driven by the following factors:
PCE Inflation Data: The Personal Consumption Expenditures (PCE) index stabilized at 2.8% in April, matching economists’ forecasts.
Why have both gold futures and spot gold declined on 31/05/2024?
On the final trading day of May, gold futures for the August 2024 contract—which is now the most commonly traded—saw a double-digit decrease. The August contract in New York ended the day at $2,345.60 per troy ounce, down $20.70 or 0.81%. This everyday decrease added to a weekly loss of $11.10, or 0.47%. Nevertheless, in May, gold was able to barely record a monthly gain of $21.10, or 0.91%.
The most recent inflation figures from the Bureau of Economic Analysis’s (BEA) April Personal Consumption Expenditures (PCE) price index report are currently being interpreted by market participants. According to the report, personal income increased by $65.3 billion, disposable personal income (DPI) increased by $40.2 billion, and personal consumption expenditures (PCE) increased by $39.1 billion, or 0.2%.
The BEA reports that “The PCE price index rose by 0.3%. With food and energy excluded, the PCE price index rose by 0.2 percent. April saw a 0.1 percent decline in the real PCE and 0.1 percent decline in the real DPI; goods saw a 0.4 percent reduction and services saw a 0.1 percent increase.”
According to the analysis, which supported earlier projections from MarketWatch and Reuters, inflation in April would rise by 2.7% year over year and remain above the Federal Reserve’s 2% objective. But for the first time in 2024, inflationary pressures have not increased from the preceding month but have remained constant.
The likelihood of a rate reduction at the Federal Open Market Committee (FOMC) meeting in September has grown in light of the most recent statistics. The likelihood of a rate reduction by September has increased from 50.5% to 53.2%, per the CME’s FedWatch tool. While the chances of a 0.5% cut went from 5.4% to 6.6%, the likelihood of a 0.25% rate drop increased from 45.1% to 46.6%.
The gold futures contract for August did, technically speaking, close below its 50-day simple moving average. Market analysts will be keenly observing to see if gold prices manage to climb back above this crucial level or if there is a deeper slide below it.
Since gold does not yield interest, lower interest rates often increase gold prices over time, while higher rates tend to decrease the allure of the precious metal. Gold managed to end May with a gain of almost 1% despite the recent decline in price, helped by the expectation of future easing of monetary policy.
 Noor Trends News, Technical Analysis, Educational Tools and Recommendations


