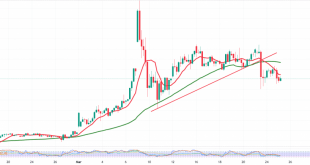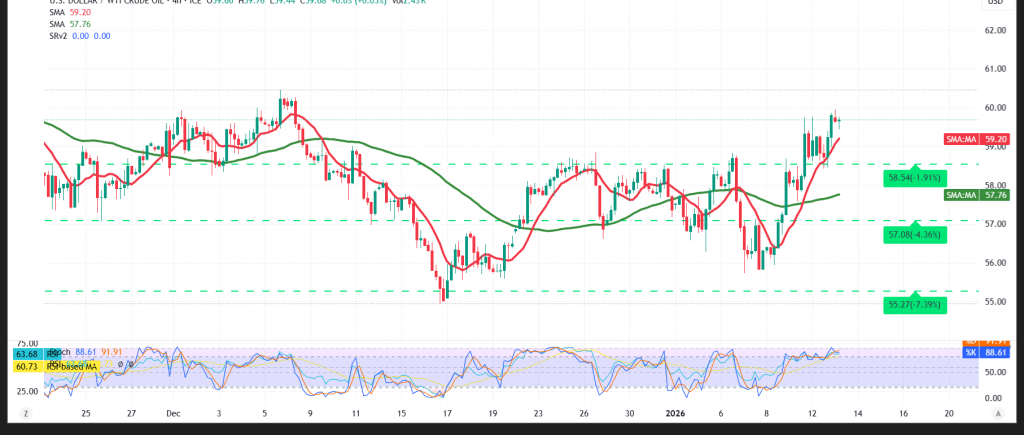
U.S. crude oil (WTI) futures opened the week with a strong bullish gap, surging to a high of $59.95 per barrel — a clear signal of renewed short-term upside momentum.
Technical Outlook – 4-Hour Chart
Price action is currently supported by a favorable technical environment. Simple moving averages continue to provide dynamic support, confirming the persistence of the upward trend.
Momentum indicators further validate this outlook. The Relative Strength Index (RSI) has exited oversold territory, reflecting a clear recovery in buying strength and a shift toward positive market sentiment.
As long as WTI maintains daily trading above the $58.90 support level, the bullish scenario remains the most likely path, with an initial target at $60.25. A sustained break above this level would reinforce upside momentum, opening the way toward $60.80.
On the downside, a break below $58.80 would temporarily invalidate the bullish structure and trigger a corrective move, with scope for a pullback toward $57.90 before any renewed recovery attempts.
Market Warnings:
- High-impact U.S. economic data is due today, particularly the monthly and annual Consumer Price Index (CPI), which could trigger sharp volatility.
- Risk levels remain elevated amid ongoing trade and geopolitical tensions, keeping all scenarios on the table.
Trading in CFDs involves high risk, and therefore all scenarios are subject to potential outcomes. The analysis provided above is not a recommendation to buy or sell but rather an illustrative reading of price action on the chart.
| S1: 58.75 | R1: 60.25 |
| S2: 57.90 | R2: 60.80 |
| S3: 57.30 | R3: 61.70 |