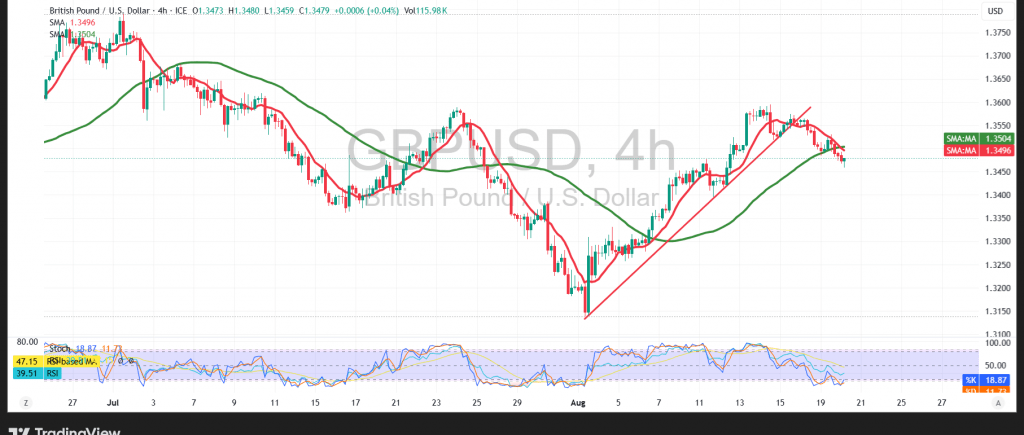
The GBP/USD pair recorded significant declines during the previous trading session, hitting its lowest level at 1.3462.
Technical Outlook – 4-Hour Timeframe
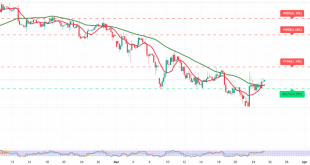
The pair’s stability below the Simple Moving Average (SMA), which coincides with the previously broken support area now acting as a resistance level at 1.3510, reinforces this level’s strength as resistance. Additionally, the pair previously broke a rising trendline, as shown on the chart.
Probable Scenario
Bullish Scenario: As long as the price remains below the 1.3515 resistance, the bearish trend is the most likely scenario. We are targeting 1.3445 as the first support area, followed by 1.3400 as the next support area.
Bearish Scenario: A confirmed breakout above 1.3515 with an hourly candle close above it could reverse the bearish trend, paving the way for an initial retest of 1.3560.
Fundamental Note:
High-Impact Data: Today, we are awaiting high-impact economic data from the U.S. economy: the Federal Reserve’s FOMC Meeting Minutes. This data could cause strong price volatility upon its release.
Warning
The risk level is high amid ongoing trade and geopolitical tensions, and all scenarios could be possible.
Disclaimer
Trading in CFDs involves risks, and therefore all scenarios are subject to potential outcomes. The analysis provided above is not a recommendation to buy or sell but rather an illustrative reading of price action on the chart.
| S1: 1.3445 | R1: 1.3515 |
| S2: 1.3400 | R2: 1.3560 |
| S3: 1.3370 | R3: 1.3590 |