US Crude Oil (WTI) Technical Analysis
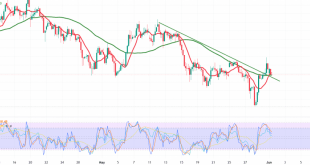
US crude oil prices encountered intense selling pressure across recent trading sessions, sliding to an intraday low of $86.38 per barrel before mounting an attempt to claw back some of the losses.
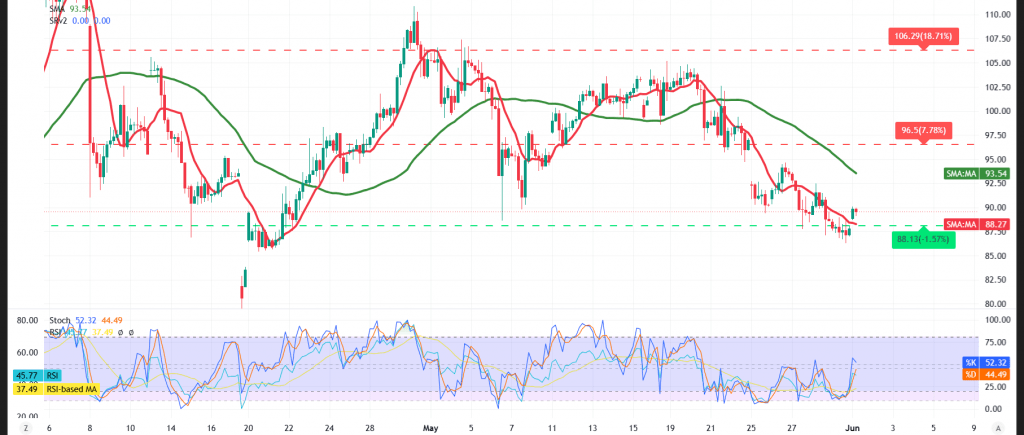
Technical Outlook – 4-Hour Timeframe:
On the short-term horizon, oil is working to regain its equilibrium, with constructive signals emerging on the Relative Strength Index (RSI) after the indicator dipped into oversold territory — a development that could provide the technical underpinnings for a short-term corrective rebound.
That said, the simple moving averages continue to impose downward pressure on the price from above, which could cap the pace of any recovery and leave current gains vulnerable to profit-taking near the key resistance zones.
Expected Scenarios:
Bullish (Most Likely) Scenario:
Should intraday trading establish a foothold above the $87.70 support floor, the corrective rebound is likely to extend further, with the initial target set at:
- $90.90
A decisive break above this level would extend the gains toward:
- $91.30 as the subsequent objective
Bearish Scenario:
Conversely, a return and stabilization beneath the $87.70 threshold would force the contract to resume its downside trajectory at a more accelerated pace, with:
- $85.80 emerging as the initial downside target
Disclaimer: Trading oil carries substantial risk and may not be suitable for all investors.
Risk Alert: Risk levels remain elevated amid persistent trade frictions and geopolitical tensions — all scenarios should be considered plausible.
Trading in CFDs involves high risk, and therefore all scenarios are subject to potential outcomes. The analysis provided above is not a recommendation to buy or sell but rather an illustrative reading of price action on the chart.
| S1: 87.25 | R1: 90.90 |
| S2: 84.95 | R2: 92.35 |
| S3: 83.50 | R3: 94.65 |