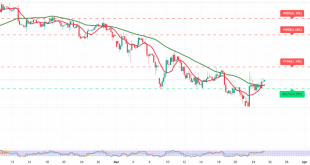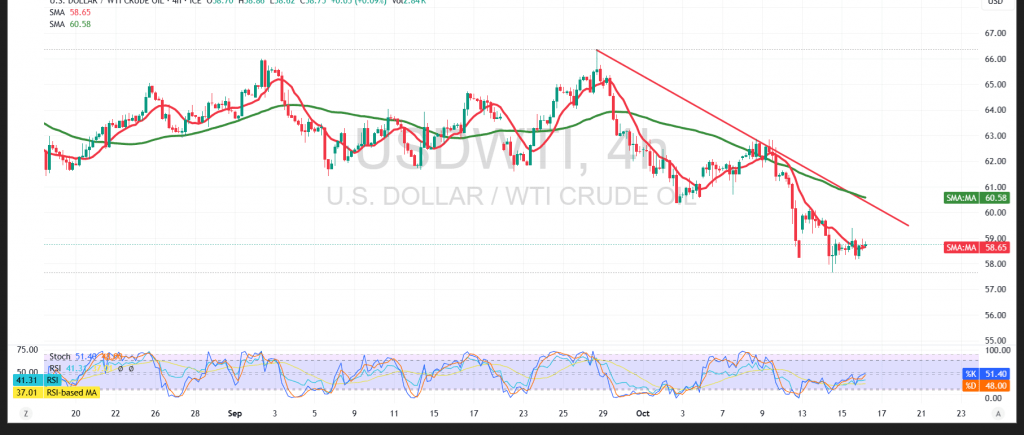
WTI crude (U.S. futures) met the prior report’s target at $58.70, printing a low of $58.22 before a modest rebound. The move appears corrective within a broader bearish structure.
Technical:
Price remains capped beneath down-sloping simple moving averages, which act as dynamic resistance and may limit upside attempts. RSI is trying to firm, but signals are tentative against the prevailing downtrend on the 4-hour chart.
Base case:
While intraday trading holds below $59.30–$59.35, the path of least resistance is lower. A clean break under $58.20 would likely extend losses toward $57.60.
Alternative:
A decisive close above $59.35 would temper immediate downside pressure and allow a recovery toward $60.00, though rebounds are assumed corrective unless higher levels are reclaimed.
Risk:
Geopolitical and trade headlines can drive sharp swings. Use disciplined sizing, clear invalidation levels, and tight risk control; this market may not suit all investors.
Trading in CFDs involves high risk, and therefore all scenarios are subject to potential outcomes. The analysis provided above is not a recommendation to buy or sell but rather an illustrative reading of price action on the chart.
| S1: 58.20 | R1: 59.35 |
| S2: 57.60 | R2: 60.00 |
| S3: 56.95 | R3: 60.50 |