WTI crude oil futures gave back a portion of their recent gains, posting a clear pullback during the previous trading session.
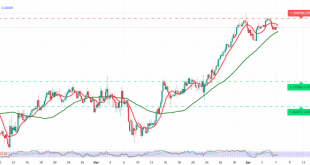
Technical Outlook – 4-Hour Chart
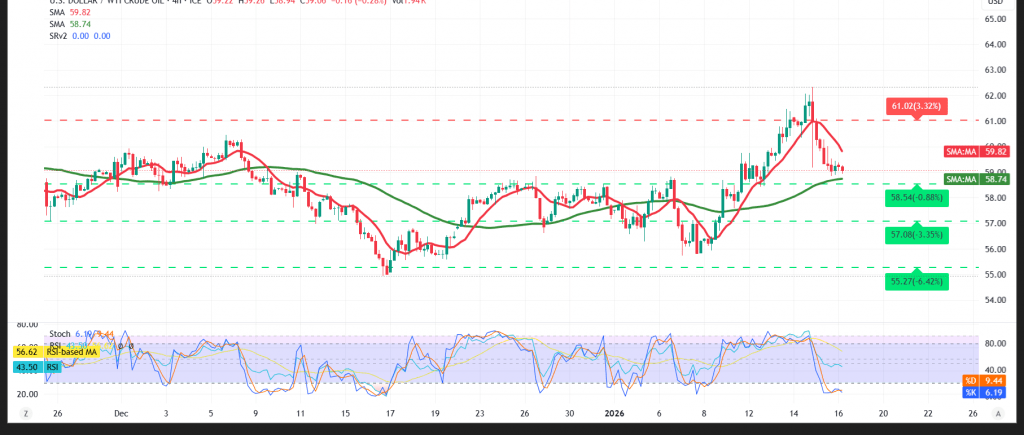
Despite the decline, the broader technical structure remains constructive. Simple moving averages continue to offer dynamic support from below, preserving the medium-term upward trend.
Momentum indicators also lean supportive. The Relative Strength Index (RSI) is working to ease overbought conditions and establish a potential base, a development that could provide a solid platform for a rebound.
As long as daily trading remains above the $58.30 support level, the bullish scenario stays intact, with $59.80 standing as the first upside target. A break above this level would likely reinforce positive momentum and open the door toward $60.40.
On the downside, a confirmed break below $58.30 would temporarily invalidate the bullish setup and shift bias lower, with scope for a corrective move toward $57.45 before any renewed recovery attempts.
Risk Warning:
Market conditions remain high-risk amid ongoing trade and geopolitical tensions, and all scenarios remain possible.
Trading in CFDs involves high risk, and therefore all scenarios are subject to potential outcomes. The analysis provided above is not a recommendation to buy or sell but rather an illustrative reading of price action on the chart.
| S1: 58.25 | R1: 60.45 |
| S2: 57.45 | R2: 61.85 |
| S3: 56.05 | R3: 62.65 |