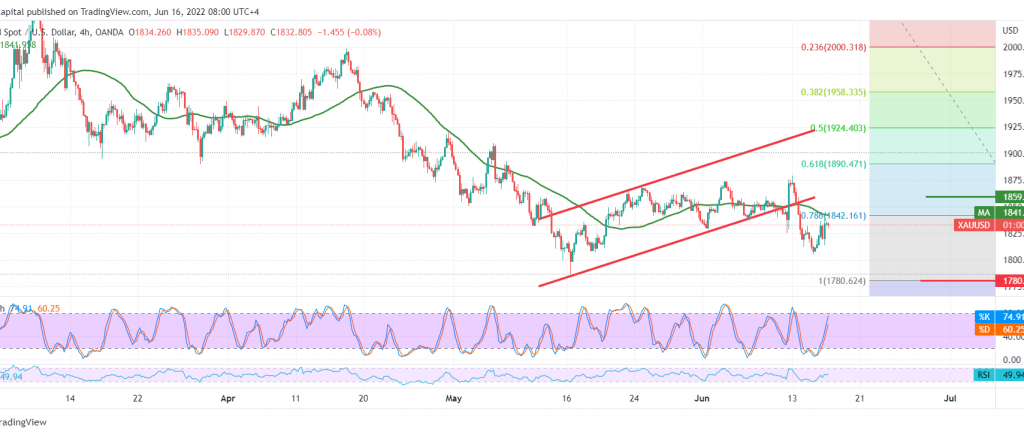
Mixed trading dominated gold’s movements during yesterday’s trading session, affected by the Federal Reserve’s decision to raise interest rates by 75 basis points, recording the highest at 1841 and the lowest around 1807.
On the technical side, today, the current moves are witnessing stability below the resistance level of 1842, which represents one of the most important keys of the daily trend, and converges around the 50-day moving average, which adds more strength to it, in addition to the negativity of the stochastic indicator.
On the other hand, the 14-day momentum indicator starts sending positive signals on short intervals, supporting the occurrence of a bullish slope supported by the stability of the intraday trading above 1820.
With the conflicting of the leading technical signals, we prefer to monitor the price behaviour by waiting for one of the following scenarios:
Rising above 1842 is a catalyst that enhances the possibility of touching 1846 and 1850, respectively, and extends the goals to visit 1860.
Sneaking below 1818/1820 puts the price under negative pressure, and its targets are initially located around 1812 and 1800. However, it should be noted that breaking 1800 led gold directly towards 1792 and 1780 later.
Note: The risk level may be high.
Note: The BoE monetary policy summary is due today, and we may witness price volatility.
Note: Trading on CFDs involves risks. Therefore, all scenarios may be possible. This article is not a recommendation to buy or sell but rather an explanatory reading of the price movement on the chart.
| S1: |
 Noor Trends News, Technical Analysis, Educational Tools and Recommendations

