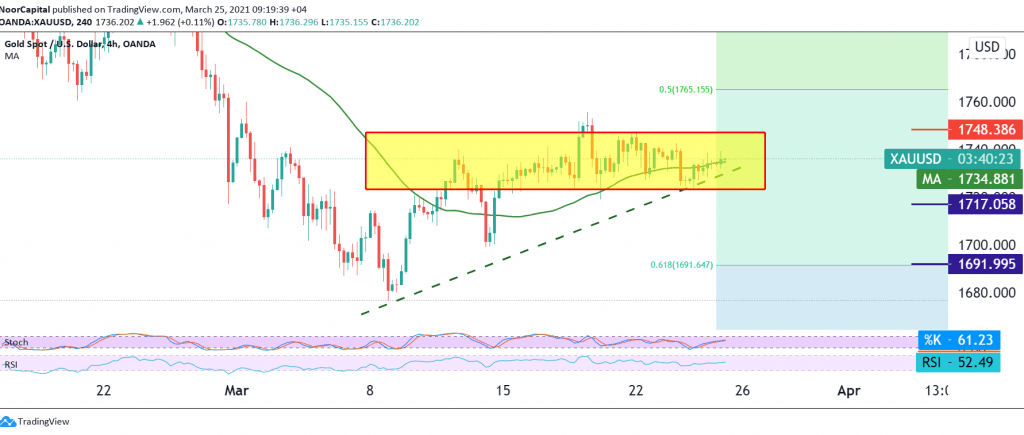
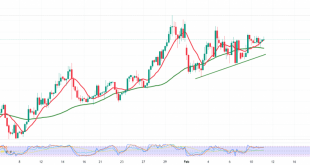
Narrow-range sideways trading dominated gold’s movements for the second session in a row, pinging from the bottom above the support level at 1722 and from below the resistance level at 1747.
Technically, we will maintain the same technical conditions, waiting for a signal to stimulate the price. With a closer look at the 4-hour chart, we find gold is turning around the 50-day moving average in attempts to rise.
On the other hand, we find the clear negative signs on Stochastic, which are accompanied by the RSI losing its bullish momentum over short periods of time.
We tend to be negative, but we prefer to confirm breaking 1726 to target 1722, knowing that breaking the latter facilitates the mission required to visit 1713, and losses may extend to 1706 later.
From the top, to move upwards and rise again above 1747, which represents the key to protecting the downside movement over the intraday basis.
| S1: 1722.00 | R1: 1741.00 |
| S2: 1713.00 | R2: 1756.00 |
| S3: 1705.00 | R3: 1765.00 |
 Noor Trends News, Technical Analysis, Educational Tools and Recommendations

