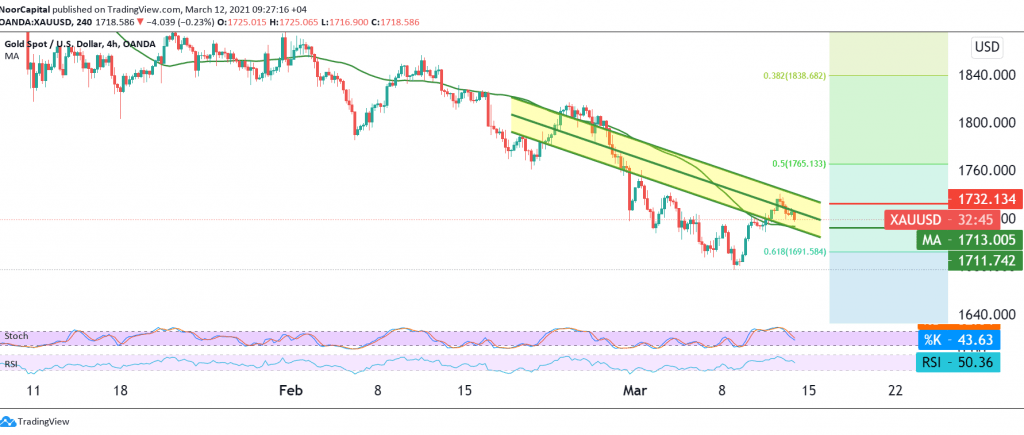
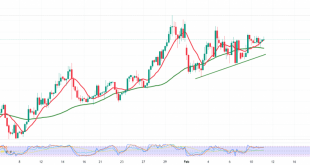
Trading tilted to the negativity dominated the movements of gold during the previous session after it collided with the resistance level 1740, which forced it to trade negatively again.
On the technical side today, and with a closer look at the 4-hour chart, we find the 50-day moving average is still holding the price from below and it meets near the support level of 1691, a correction of 61.80%, which supports the continuation of the rise, and by moving to short intervals, we find the price is stable below a resistance level 1728, and the RSI indicator is starting to lose upward momentum.
With the conflict of technical signals, we prefer to remain neutral to be in front of one of the following scenarios: Reactivating short positions requires us to witness a clear break of the support level of 1710, which puts the price under strong negative pressure. The downward trend to visit 1686 tentatively.
Activating long positions requires a clear and strong breakout of the resistance level of 1728 and the most importantly 1732, and this is considered as a catalyst that facilitates the task required to visit 1747 and then 1756.
| S1: 1710.00 | R1: 1732.00 |
| S2: 1701.00 | R2: 1747.00 |
| S3: 1686.00 | R3: 1755.00 |
 Noor Trends News, Technical Analysis, Educational Tools and Recommendations

