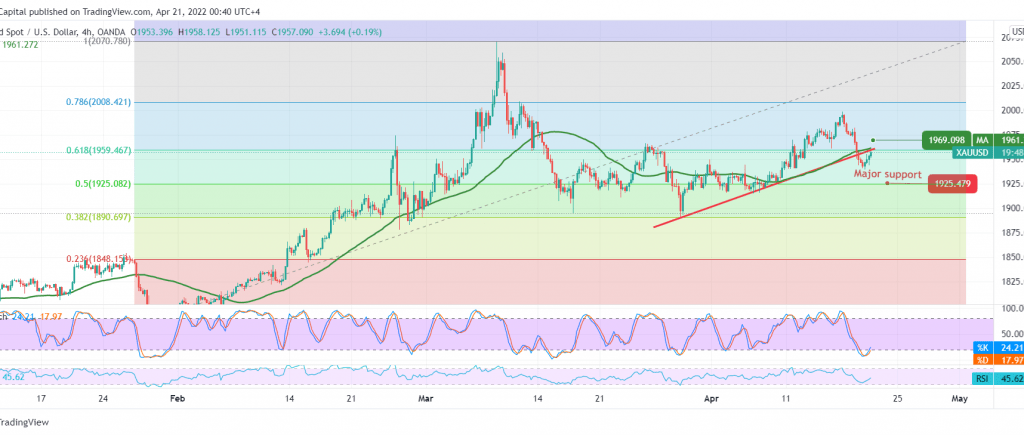
Gold prices repeated their attempts to rise again, benefiting from stability above the 1940 support level, rebounding to the upside to retest the previously broken support level that turned into the 1959 resistance level.
On the technical side, the 50-day simple moving average is still trying to pressure the price from above, supporting the return of the bearish bias and stabilizing trading below 1959, 61.80% Fibonacci correction. On the other hand, positive crossover signs started appearing on stochastic.
With technical signals conflicting, we prefer to monitor the price behavior of gold to activate the following pending orders:
Consolidation above 1959 is a catalyst that enhances the chances of rising to visit 1962 and 1967, respectively, and gains may extend to visit 1969 initially, and this requires stability above 1940.
As shown on the chart, declining below 1940 might force gold prices to retest the 1925 50.0% Fibonacci retracement.
Note: Today, we are awaiting the Federal Reserve’s speech, and we may witness high volatility in prices.
Note: Trading on CFDs involves risks. Therefore, all scenarios may be possible. This article is not a recommendation to buy or sell but rather an explanatory reading of the price movement on the chart.
| S1: |
 Noor Trends News, Technical Analysis, Educational Tools and Recommendations

