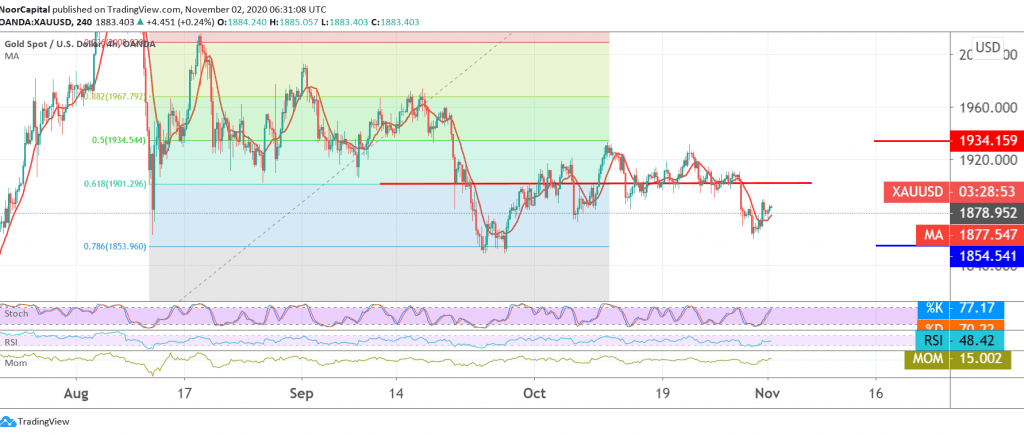
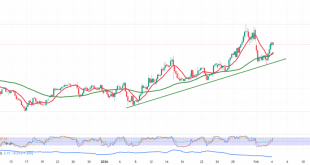
Negative trading dominated gold prices, as we expected, touching the target published in the previous analysis at 1860, to post a low at 1864.
Technically, the current movements are witnessing a slight upward tendency, as a result of approaching the support level of 1860 in the attempts to re-test 1894.
Looking at the 240-minute chart, we find that the 50-day moving average continues to pressure the price in conjunction with the clear negative signals on Stochastic.
The bearish scenario remains intact, knowing that trading below 1869 and most importantly 1860 extends gold’s losses towards 1854 and then 1844, and may extend later to 1800.
On the other hand, consolidation above 1905/1901 negates the bearish scenario and pushes gold prices towards an upside with targets begin at 1934.
Caution: The level of risk is high
| S1: 1869.00 | R1: 1894.00 |
| S2: 1854.00 | R2: 1905.00 |
| S3: 1844.00 | R3: 1919.00 |
 Noor Trends News, Technical Analysis, Educational Tools and Recommendations

