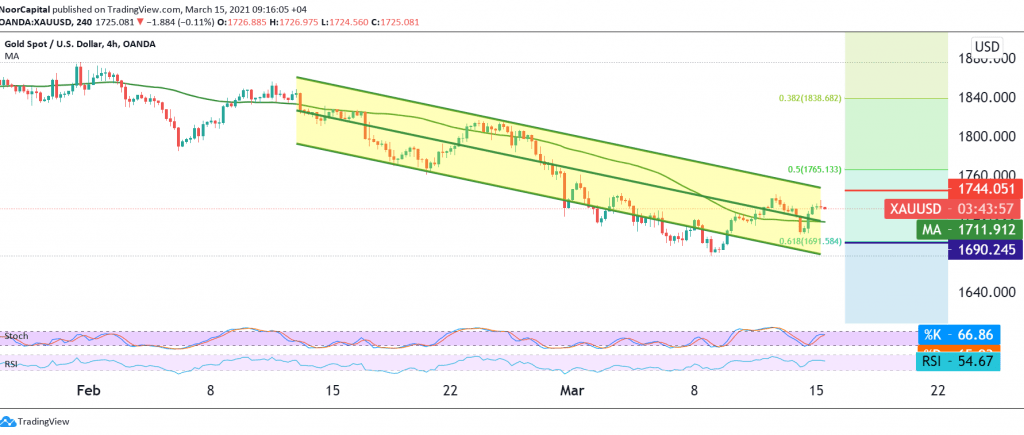
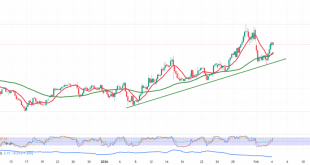
Mixed trades dominated gold’s movements last Friday within a bullish context, after it found a strong support level around the psychological barrier 1700, to rebound to the upside to re-test the 1732 resistance level.
Technically speaking, and with a closer look at the chart, we find the 50-day moving average holding the price from below and meeting around the 1710/1711 support level and adding to this level more strength, as we find the RSI trying to get rid of the current negative signs.
From here, with the stability of the intraday trading above 1715 and in general above 1705, the bullish scenario remains valid and effective targeting 1740 first target, taking into account that confirming the breach of 1740 extends gold’s gains, opening the way directly towards 1754/1756.
A reminder that trading and stability of the price below 1705 may put the price under negative pressure, and we witness a bearish tendency aiming to retest 1691 61.80% correction. Warning: The level of risk may be high today.
| S1: 1705.00 | R1: 1740.00 |
| S2: 1684.00 | R2: 1754.00 |
| S3: 1670.00 | R3: 1775.00 |
 Noor Trends News, Technical Analysis, Educational Tools and Recommendations

