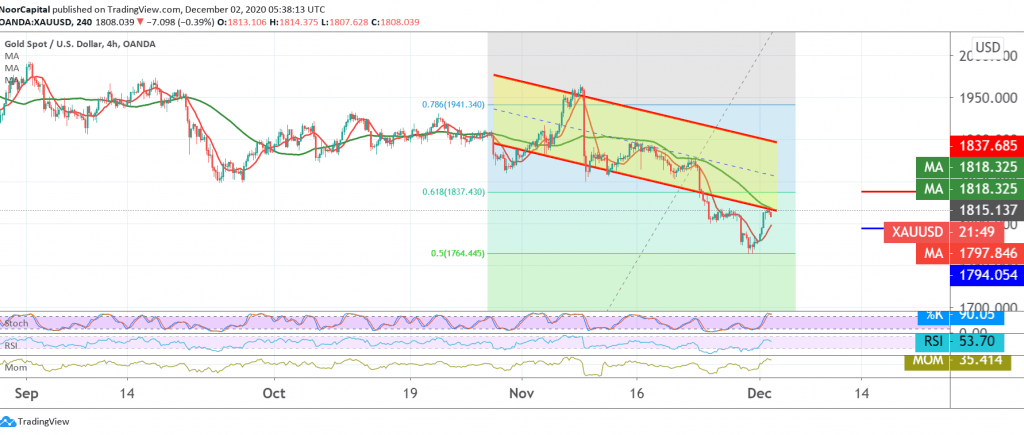
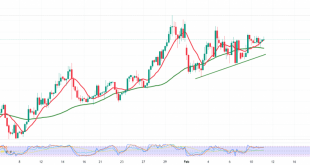
Gold prices were able to achieve gains during the previous trading session, as part of a technical outlook for the simple upward correction within the downward trend indicated in the previous analysis, touching our required corrective target of 1800 to reach its highest level at 1817.
Technically speaking, and by looking at the 240-minute chart, the current movements are witnessing a bearish tendency as a result of the collision with the resistance level of 1817.
We find the 50-day moving average that constitutes an obstacle to the price, and on the other hand, the stability of trading above 1800 and generally above 1795 in addition to Gold continues to receive positive signals from the RSI Technical factors support the continuation of the bullish correction.’
With the conflict of technical signals, we will stand on the fence for the moment, in order to maintain profitability rates, so that we are facing one of the following scenarios:
To complete the minor bullish correction, we need to witness a clear and strong breach of resistance at 1817, which is a catalyst that enhances the chances of the upside move to be the next leg of 1837, a Fibonacci retracement of 61.80%.
While the return of stability again below 1795, the price will lead to the official downside path towards 1783 and then 1750.
| S1: 1783.00 | R1: 1825.00 |
| S2: 1758.00 | R2: 1842.00 |
| S3: 1741.00 | R3: 1867.00 |
 Noor Trends News, Technical Analysis, Educational Tools and Recommendations

