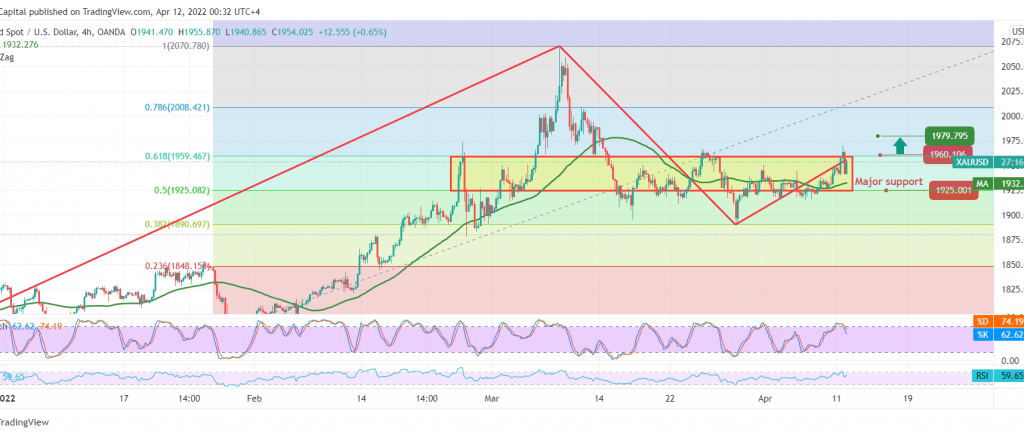
Positive moves dominated gold prices during the first trading sessions after it succeeded in liberating from the sideways path so that gold could breach the 1940 strong supply zone, touching the first official target required during the previous analysis.
Technically, we tend to the positivity, relying on the stability of trading above the previously breached resistance-into-support at 1940, in addition to the positive stimulus coming from the 50-day moving average, which continues to hold the price from below, and this is a scenario that supports the upside, on the other hand, gold was unable to close daily above the pivotal resistance level 1960 represented by the 61.80% Fibonacci correction, and this increases the possibility of a drop
With the technical signals conflicting and the return to trading between 1940 and 1960, we wait for the activation of the following pending orders:
To complete the ascending path, we need to witness stability above 1940 and price coherence above 1960, which is a motivating factor that extends gold’s gains so that we are waiting for 1966 and 1978, respectively.
Declining below 1940 may force gold to retest key support at the current 1925 trading levels before determining the next price destination.
Note: Trading on CFDs involves risks. Therefore, all scenarios may be possible. This article is not a recommendation to buy or sell but rather an explanatory reading of the price movement on the chart.
| S1: |
 Noor Trends News, Technical Analysis, Educational Tools and Recommendations

