
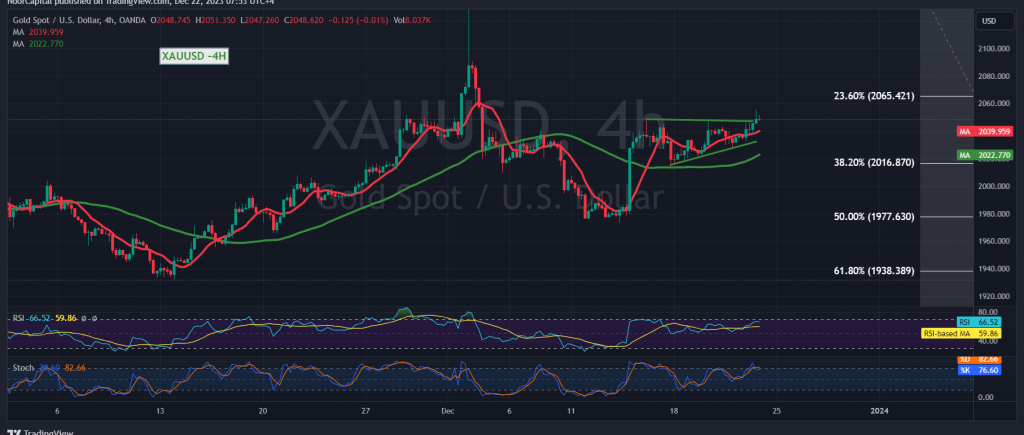
Gold prices successfully reached the initial target outlined in the previous technical report, hitting the price of 2051 and achieving a peak at $2055 per ounce.
On the technical front today, a closer examination of the 240-minute time frame chart reveals that the simple moving averages continue to provide a positive impetus, supporting the likelihood of further increases. Additionally, there is stability above the 2034 resistance level, now converted into a support level through the concept of exchanging roles.
As a result, the upward trend remains valid and robust. It’s noteworthy that consolidation above 2055 acts as a motivating factor, enhancing and accelerating the strength of the daily upward trend. Consequently, anticipation is set for reaching 2058, with gains extending towards 2065, reflecting a 23.60% correction, and possibly progressing to 2068.
A crucial reminder is that a closure below 2034 for at least an hour places the price under negative pressure, potentially opening an opportunity for a retest of the main support at 2016, representing the Fibonacci retracement at 38.20%.
Warning: Today, high-impact economic data is expected from the American economy, including the “annual/monthly core personal consumer spending prices” and “Consumer Confidence” issued by the University of Michigan. From the United Kingdom, we anticipate the release of the “Retail Sales” indicator.
Concerning the Canadian economy, the monthly “Gross Domestic Product” index is noteworthy. Significant price volatility may occur at the time of news release.
Geopolitical Warning: Persistent geopolitical tensions contribute to a heightened risk environment, potentially resulting in increased price volatility. Exercise caution.
Note: Trading on CFDs involves risks. Therefore, all scenarios may be possible. This article is not a recommendation to buy or sell but rather an explanatory reading of the price movement on the chart.
| S1: |