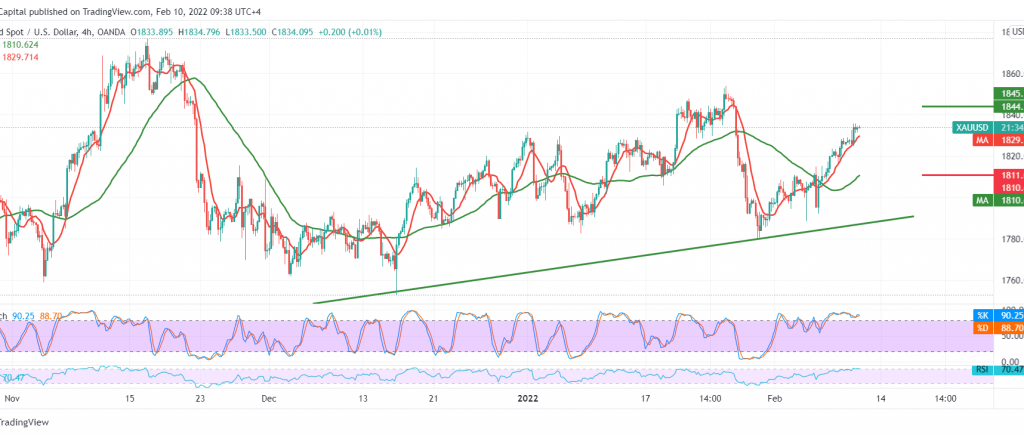
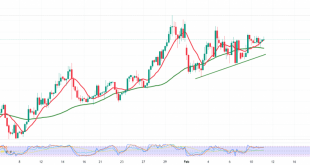
Gold prices maintained their gains within the expected bullish path, heading to touch the target price station at 1836, recording its highest level during the last session’s trading of 1835.
Technically, and by looking at the 240-minute chart, we notice that the price continues to receive positive momentum signals from the 14-day momentum indicator, in addition to the continuation of moving above the 50-day moving average, which still supports the bullish price curve.
With intraday trading remaining above 1825, there may be a possibility to resume the rise, provided that we witness a clear and strong breach of the 1837 resistance level, and this may contribute to consolidating gains to visit the areas of 1842 and then 1848 next station as long as the intraday movements are stable above 1825.
The decline below 1825 and the price stability below it may postpone the upside, and we witness a retest of 1818 and 1810 before any attempt to rise again.
Note: Trading on CFDs involves risks. Therefore, all scenarios may be possible. This article is not a recommendation to buy or sell but rather an explanatory reading of the price movement on the chart.
| S1: 1826.00 | R1: 1837.00 |
| S2: 1818.00 | R2: 1842.00 |
| S3: 1810.00 | R3: 1848.00 |
 Noor Trends News, Technical Analysis, Educational Tools and Recommendations

