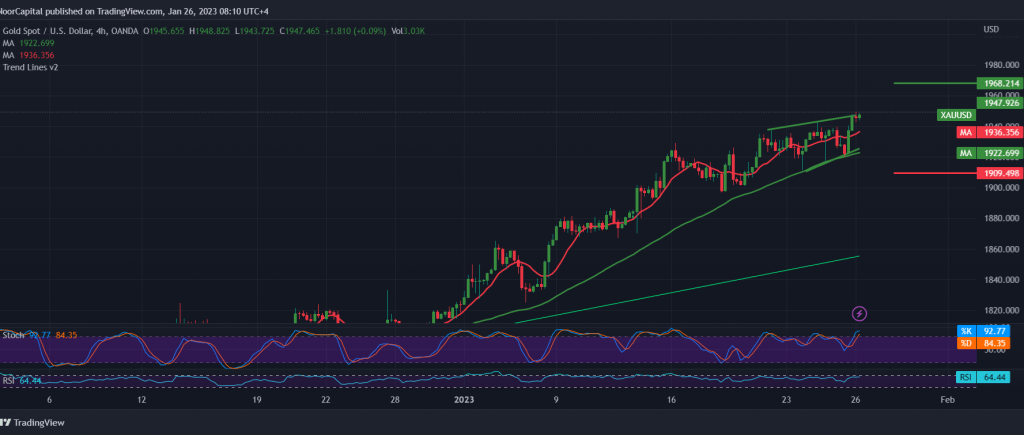
For the second session in a row, the strong levels of demand published during all the technical reports for the current week, at 1920, proved their effectiveness after gold was able to establish a solid support ground to force it to rebound upward and continue the ascent towards the official target station 1950, recording its highest level during the early trading of the morning period 1950 $ per ounce.
Technically, by looking at the 240-minute chart, we find the 50-day simple moving average meeting near 1927 and adding more strength to it, supporting the continuation of the bullish trend, coinciding with the RSI’s defense of the bullish trend.
There may be a possibility to continue the rise, but on the condition that we witness a clear and strong breach and consolidation of the price above the pivotal resistance of 1950, and that increases, accelerates, and confirms the strength of the rise, opening the door to 1958 and 1969, respectively.
Stability of trading above 1920 is a prerequisite for activating the bullish scenario mentioned above, and breaking it will immediately stop the possibility of the rise. We are witnessing the beginning of a bearish wave, whose initial targets start at 1907/1900 and extend towards 1896.
Note: Stochastic is negative and we may witness some fluctuation in the price before getting the official trend.
Note: Today, we are awaiting high-impact economic data issued by the US economy, The estimated reading of the quarterly GDP, and we may witness a high fluctuation.
Note: Trading on CFDs involves risks. Therefore, all scenarios may be possible. This article is not a recommendation to buy or sell but rather an explanatory reading of the price movement on the chart.
| S1: |
 Noor Trends News, Technical Analysis, Educational Tools and Recommendations

