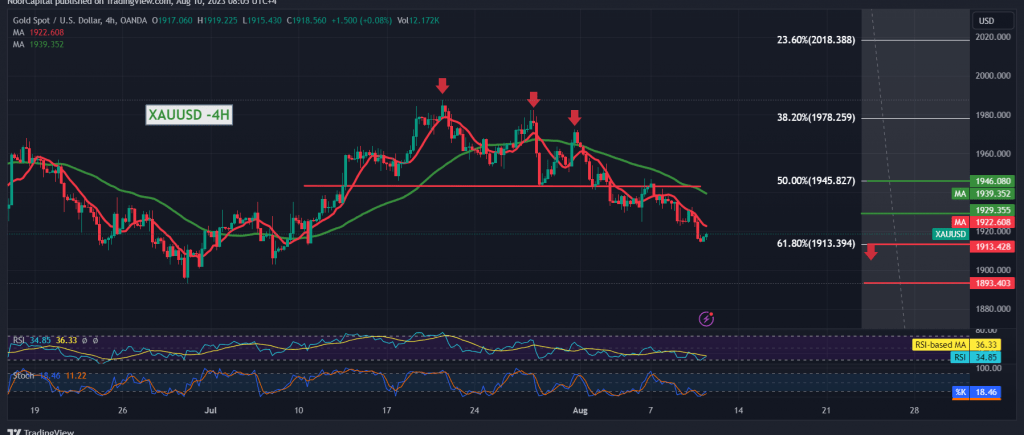
Gold prices achieved the negative outlook as we expected, reaching the main target during the previous trading session at $1913 per ounce.
Technically, and by looking at the 4-hour chart, we find the stochastic indicator around the intraday overbought areas, and we notice the continuation of the negative pressure coming from the simple moving averages that support the continuation of the bearish daily trend.
Therefore, the possibility of a decline remains valid and effective, provided that we witness the break of 1913, Fibonacci correction of 61.80%, as shown on the chart, knowing that breaking the support above extends gold’s losses, so we are waiting for 1902 and 1892 as official waiting stations.
To remind you, closing at least an hourly candlestick above 1929 postpones the chances of a decline but does not cancel them and leads gold prices to recover temporarily to retest 1945 Fibonacci correction 50.0%.
Note: Today we are awaiting high-impact economic data issued by the US economy, “Consumer Price Index” and “Weekly Unemployment Claims”, and we may witness high price volatility.
Note: Trading on CFDs involves risks. Therefore, all scenarios may be possible. This article is not a recommendation to buy or sell but rather an explanatory reading of the price movement on the chart.
| S1: |
 Noor Trends News, Technical Analysis, Educational Tools and Recommendations

