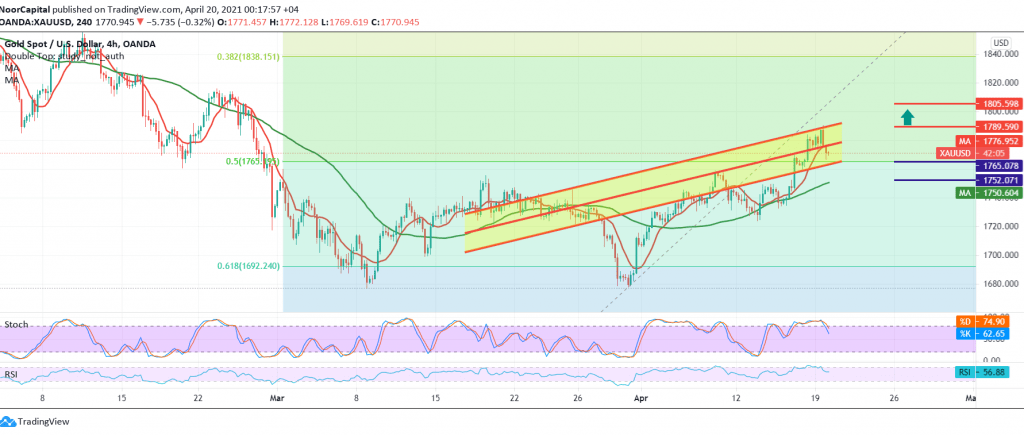
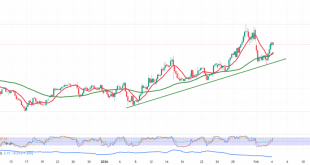
Gold prices were able to continue achieving gains, as we expected during the previous trading session, approaching a few points difference from the first official leg located at 1794, to record its highest level of 1790.
Technically, and with a closer look at the 60-minute chart, we find that the resistance level 1790 has become an intraday obstacle to the yellow metal, and we find that the stochastic indicator began to gradually lose the bullish momentum.
Therefore, we believe that there is a possibility for a bearish bias, as long as trading remains below 1787, with the aim of retesting the previously breached resistance-into-support at 1765, a 50.0% correction, and breaking it puts the price under negative pressure to visit 1756 and may extend later towards 1750 before attempting to rise again.
Note: In the event that prices stabilize again above 1787/1790, this will negate the re-test scenario and lead the price to the official bullish path with the target of 1800 and 1804, respectively.
| S1: 1756.00 | R1: 1787.00 |
| S2: 1742.00 | R2: 1804.00 |
| S3: 1725.00 | R3: 1818.00 |
 Noor Trends News, Technical Analysis, Educational Tools and Recommendations

