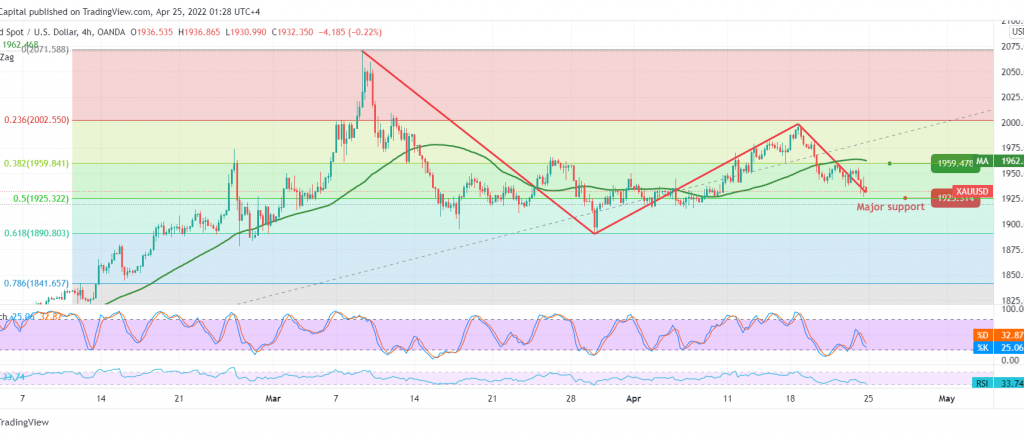
We remained on the fence during the previous analysis, explaining that we are waiting for the pending orders to be activated. We explained that trading below 1940 increases the strength of the bearish trend, targeting 1925 , gold recorded a low at 1925.
On the technical side today, and by looking at the 4-hour chart, we find gold prices ended the week’s trading above the strong demand level 1925 represented by the 50.0% Fibonacci correction as shown on the chart, and that may lead to a bullish bounce again, on the other side no The simple moving average continues to pressure the price from above, in addition to stabilizing trading below 1940, the previously broken support, which is now turned into a resistance level.
With the technical signals conflicting, we prefer to monitor the price behavior of gold, waiting one of following scenarios: Stability below 1925 extends gold’s losses, opening the door to visit 1919, a first target, and after it 1907, an initial awaited station.
Consolidation above 1925 is the 50.0% correction, and a surpassing up to the 1940 level may lead to a bullish rebound aimed at retesting 1960.
Note: Trading on CFDs involves risks. Therefore, all scenarios may be possible. This article is not a recommendation to buy or sell but rather an explanatory reading of the price movement on the chart.
| S1: |
 Noor Trends News, Technical Analysis, Educational Tools and Recommendations

