Negative trading dominated the movements of gold at the end of the last trading week after it retested the 1776 resistance level, which forced it to retreat to record significant losses around 1740.
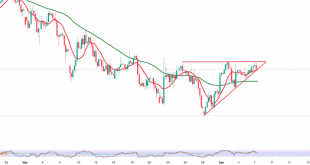
Technically, and by looking at the 240-minute chart, we notice the stability of the intraday trading below the resistance of 1785, as we find the simple moving averages continue to pressure the price from above, accompanied by the negativity of the stochastic indicator.
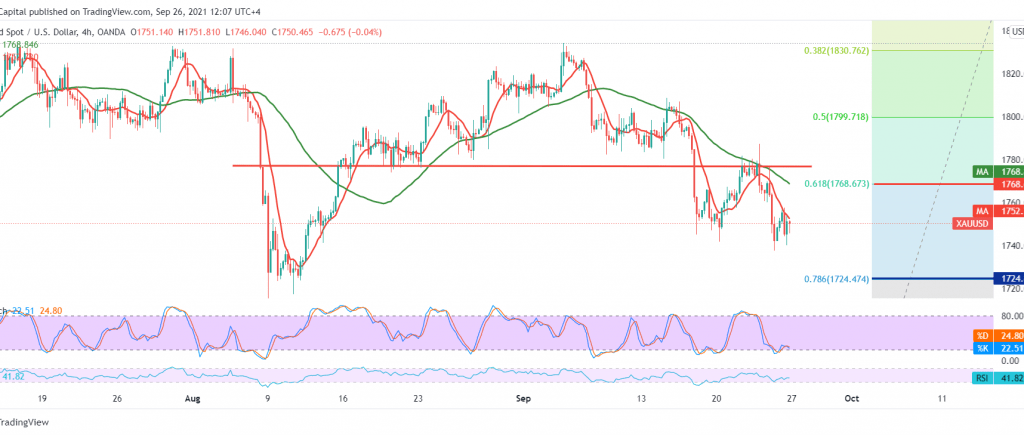
Therefore, the bearish scenario will remain valid and effective, targeting 1741/1740 as the first target, and then 1735 awaited next stations that may extend its targets towards 1732. Therefore, it is necessary to pay close attention and monitor the price behavior of gold around 1732 because Breaking it increases the strength of the downside trend, to be waiting for 1724 initially and 1700.
Activating the bearish scenario depends on the stability of daily trading below the resistance level of 1768, the Fibonacci correction of 61.80%, as shown on the chart, and in general below 1776. Note: The risk level may be high.
| S1: 1741.00 | R1: 1758.00 |
| S2: 1732.00 | R2: 1766.00 |
| S3: 1724.00 | R3: 1775.00 |