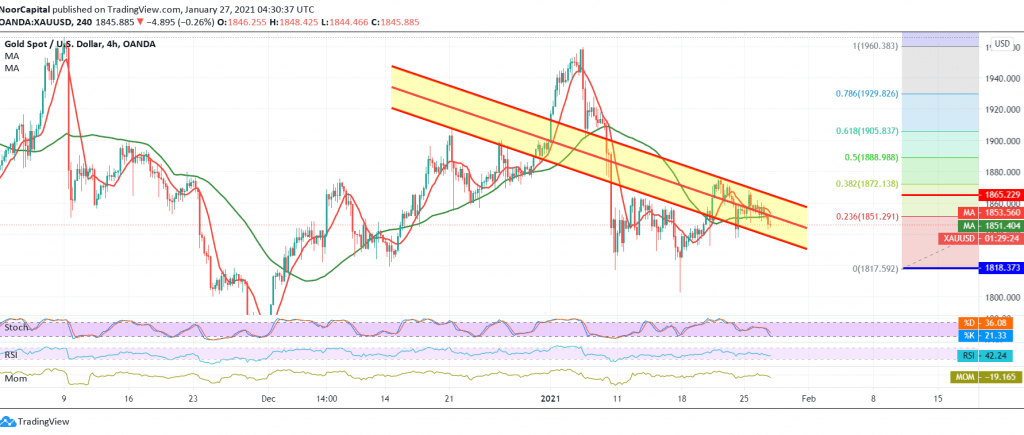
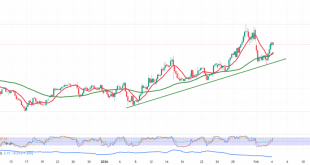
Negative trading dominated the price of the yellow metal during the early trading session of the current session within the expected bearish context, in which we depended on the fact that the activation of selling positions requires that we witness a clear breakout and stability of the price below 1851, Fibonacci retracement of 23.60%, targeting 1847 to record its lowest level at 1843.
On the technical side today, the intraday trading below the resistance level of 1851, the correction of 23.60% and in general below 1856 supports the negativity, and by looking at the chart, we can see the simple moving averages support the bearish daily price movement curve.
We are targeting 1838 as a first target, bearing in mind that confirming the breach of the aforementioned level extends gold’s losses, opening the way directly towards 1820 next official stations.
From the top, crossing to the upside and rising again above 1865 will immediately stop the attempts to decline, and we may witness a bullish tendency aimed at retesting 1872 and 38.20% Fibonacci retracement.
| S1: 1838.00 | R1: 1856.00 |
| S2: 1831.00 | R2: 1867.00 |
| S3: 1820.00 | R3: 1874.00 |
 Noor Trends News, Technical Analysis, Educational Tools and Recommendations

