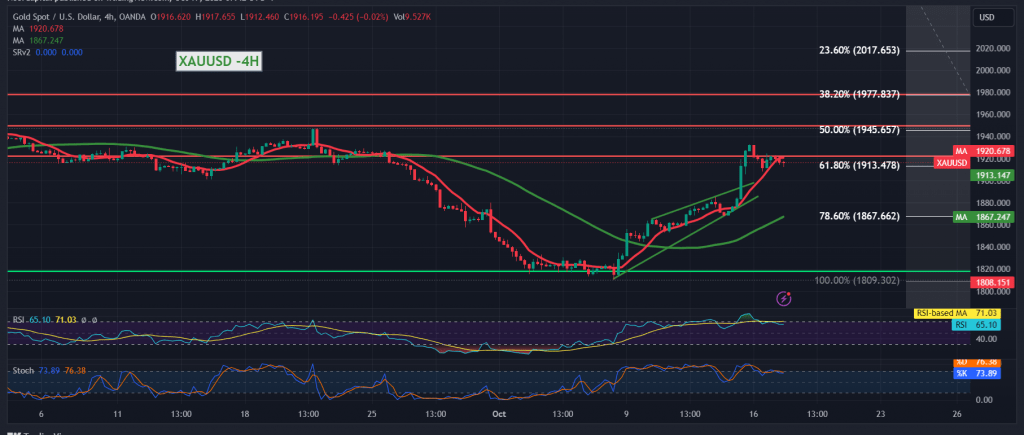
Mixed movements without a clear direction dominated gold prices during last Monday’s trading session, bringing gold back to immediate stability below the 1913 level, considered one of the most important keys to the trend during the day.
Technically, and with careful consideration, we find gold prices hovering around the pivotal resistance level of 1913, represented by the 61.80% Fibonacci retracement. The concept of exchanging roles turned into a support level, and we find the simple moving averages continuing to support the upward daily curve.
From here, with intraday trading remaining above 1913, the upward trend remains the most likely during the day, targeting 1929 as the first target, taking into account that breaching the level above increases and accelerates the strength of the upward trend, so that we are waiting for 1945, the 50.0% correction, and 1953, the next stations.
Trading stability below 1913 with the closing of the 4-hour candle below it may invalidate the activation of the proposed scenario and we will witness a rapid decline towards retesting 1905 and 1894 initially.
Note: Today, we are awaiting high-impact economic data in the US, retail sales index and the annual core consumer price index from Canada, and we may witness high volatility at the time of the news release.
Note: Trading on CFDs involves risks. Therefore, all scenarios may be possible. This article is not a recommendation to buy or sell but rather an explanatory reading of the price movement on the chart.
| S1: |
 Noor Trends News, Technical Analysis, Educational Tools and Recommendations

